
Last updated July 23, 2026
406 locations updated with 2026 rates to date
80.6% of Ontario has been updated with 2026 rates
This article explores Ontario property tax rates for over 500 places for 2026.
Scroll down to see the full table with search and sorting features and a map showing tax rates by location for Ontario, with shading to represent the highest and lowest tax areas.
Property tax rates for 2026 are now being codified, and they will be updated here when published by Ontario municipalities.
If you see that final tax rates have been published for your community and have not been reflected in the table, please contact me with a link to those details. It would help me greatly in keeping this information current.
Property Taxes in Ontario by Location for 2026
The following table shows residential rates (RT) for 2026 and 2025, along with the percentage increase from 2025 rates. The province's education portion remained unchanged in 2026.
Increases are calculated for the combined lower-tier and upper-tier and education portion, which is set by the province.
Note that the February 2026 inflation figure for the Consumer Price Index was just 1.8%.
Compare Property Taxes in Ontario by City
Map of Ontario Property Tax Rates 2026
When are Property Tax Rates Available in Ontario?
Municipalities across Ontario are required to have budgets completed and approved by April 30 of each year. The province also completes the education levy, which is included in the municipal tax rate, by this time.
The process continues with discussions on how much the budgets and property taxes are expected to increase. Until the property tax bylaws are adopted, these details are not final.
Also, interim tax bills will be sent out based on estimates. Those bills will be followed up with final bills based on the actual tax rates, with adjustments made to the year's totals.
If you work in the finance department in an Ontario municipality, you can help keep this resource current by sending an email with the details when the final rates have been set. This is especially helpful in smaller and remote communities where we don't have the resources to check frequently.
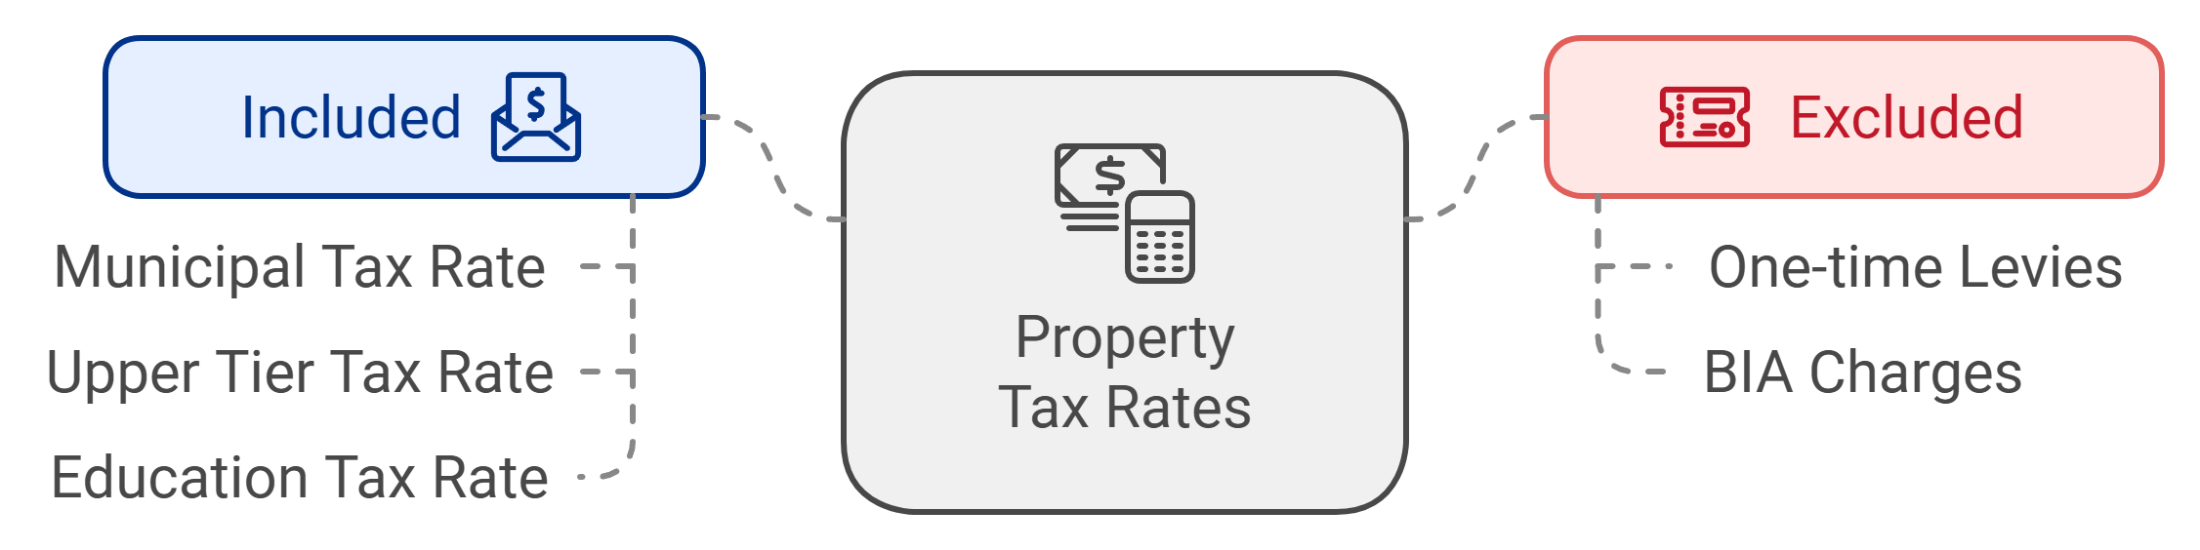
What is Included in Ontario Property Tax Rates?
Total municipal taxes include a lower-tier tax rate, an upper-tier rate (set by the county or region, if applicable), an education rate (set by the province), and sometimes additional items like infrastructure levies, street lighting and outside policing costs.
To make comparisons between areas more fair, we have excluded some items that may be included in some tax rate calculations, such as one-time levies and BIA charges.
We have researched tax rates for municipalities (including communities, wards, etc., within amalgamated areas) in Ontario, as outlined in the tables below. This research was conducted by reviewing municipal websites, property tax bylaws, rate tables, and contacting finance departments.
In order to be reasonable, we shouldn't compare the rates from remote regions to those with nearby access to competitive services or a much larger suite of municipal services. Nor should we compare areas with small populations to major cities.
In some cases, property value differences are substantial between different locations. The rates are based on assessed average value (AAV) and need to be adjusted to meet the local budget for revenue from property taxes.
It can be helpful to look at places close to each other, especially if looking to purchase a property in an area with more than one tax option. They may have different service offerings, but are the differences worth the rate differences?
Which cities have the highest property taxes in Ontario for 2026?
Manitouwadge has the highest property tax rate in Ontario for 2026, projected to be 7.54892% (2025 rate is 7.329051%).
Chatham is the city with the highest property tax rate in Ontario in 2026 at 2.33564%. This is the residential rate for the downtown area.
Which cities have the lowest taxes in Ontario for 2026?
The Archipelago South has the lowest property tax rate in Ontario for 2026 at 0.578326%. This community is just south of Parry Sound on the east side of Georgian Bay.
Markham has the lowest property tax rate for a city in Ontario for 2026 at 0.722889%.
Understanding the municipal tax process in Ontario
First, we need to understand that our municipal governments must provide similar services regardless of how much our properties are worth. In virtually all budgets, the number one expense is for the salaries of public employees - police, fire, EMS, municipal workers, road maintenance, etc. Those people make roughly the same amount from one community to the next.
In those cities with higher average property values, they can apply a lower tax rate to come up with a similar amount of revenue. Of course, there will be differences based on population size and other factors, but you get the idea.
Without delving too much into the process, they establish a budget, and determine from that how much revenue needs to come from property taxes. They then adjust what is called the millage (or mill) rate of each property type to come up with the amount needed to reach the revenue target.
Changes to the assessment value and rate each year are designed to be revenue-neutral. This means that when your MPAC assessment increases, it will be multiplied by a lower tax rate to come up with the same amount of tax. Of course, this assumes that you haven't made any material change to your property, and also that the municipality hasn't increased it's budget. Budgets do increase, of course, for inflation and changes in service levels and costs.
Toronto vs. Oshawa Taxes
For example, the City of Toronto has one of the lowest rates in the province. That may sound ideal, but when you take into account that it also has one of the highest property assessment value averages, the actual amount of municipal tax you pay there isn't much different than in other places. For example, the average assessment for a single family home in 2016 was $770,000 in Toronto, and in Oshawa, it was $356,000.
- Toronto $770,000 times 0.688% or $5,298
- Oshawa $356,000 times 1.561% or $5,557
Assessments are (normally) completed every 4 years by the Municipal Property Assessment Corporation (MPAC). An increase to the assessment value of a home is phased in over a 4 year period, whereas a decrease is applied immediately when calculating taxes.
Also, when you buy a property in Toronto, you must also pay a Municipal Land Transfer Tax on top of the Provincial Land Transfer Tax. This is a particularly heavy burden for this market, as it adds more to the closing costs that need to be saved for along with the down payment, making it even more difficult in one of the most expensive areas for real estate in Canada.
How property taxes impact the average homeowner
Using the information from the previous table, and average property assessment values for 2016 (MPAC statistics), let's see how the average single family home fares:
Of course, these figures only represent averages. On higher-end properties, the rates will have a bigger impact. The rates are also different for different property types, and there are many variations of classes in commercial and industrial properties. If you have a question regarding another type or another municipality, you can contact me and I would be happy to explain further.
If you see an update for a municipality that isn't showing on this page, or spot an error, kindly send me an email with a link to the municipality's property tax rate web page, by-law or press release to johnowen@remax.net
More Real Estate Information:
Property Tax Calculator - Durham Region
Durham Region Real Estate Market Report Daily
Development Charges by City in Ontario
About the Author

John Owen, Broker, REMAX Impact
Direct - 905-434-0067
Email - johnowen@remax.net
John is an award-winning REMAX broker serving a wide area from the GTA to Peterborough and Northumberland.
Recipient - REMAX Hall of Fame, member of: Canadian Real Estate Association (CREA), Ontario Real Estate Association (OREA), Toronto Regional Real Estate Board (TRREB).


Comments:
Post Your Comment: