

Peterborough Real Estate Market Update
Last updated October 6, 2024, at 10:55 a.m.
The Peterborough real estate market has wrapped September with balanced market conditions. Inventory is near a high point since at least 2010, while sales volume continues to lag.
Buyers are still nervous about interest rates, even with recent drops in the Bank of Canada's overnight lending rate. Rates are affecting buyer budgets, though there are signs that this sentiment is starting to change.
Mortgage rates have shown some easing recently, and getting a mortgage pre-approval (and rate lock) is essential for buyers who haven’t purchased yet.
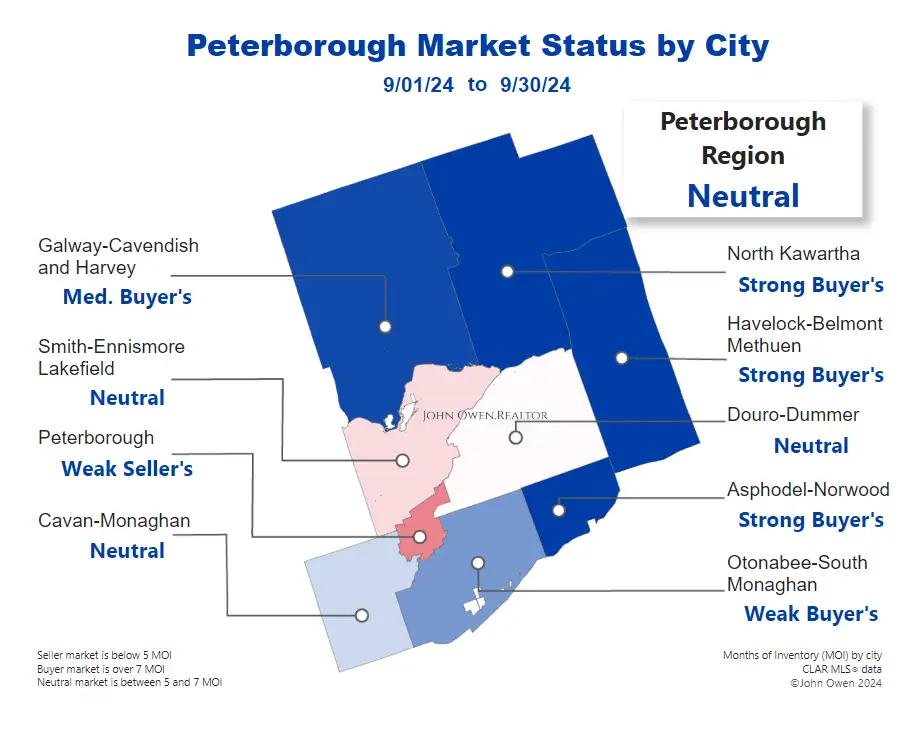
Peterborough inventory levels range from low to high, with 5.0 months of inventory (MOI) for the entire region. This means that at the current pace of sales, with no new listings, all inventory would be sold within this time frame.
Peterborough Real Estate Market September 2024
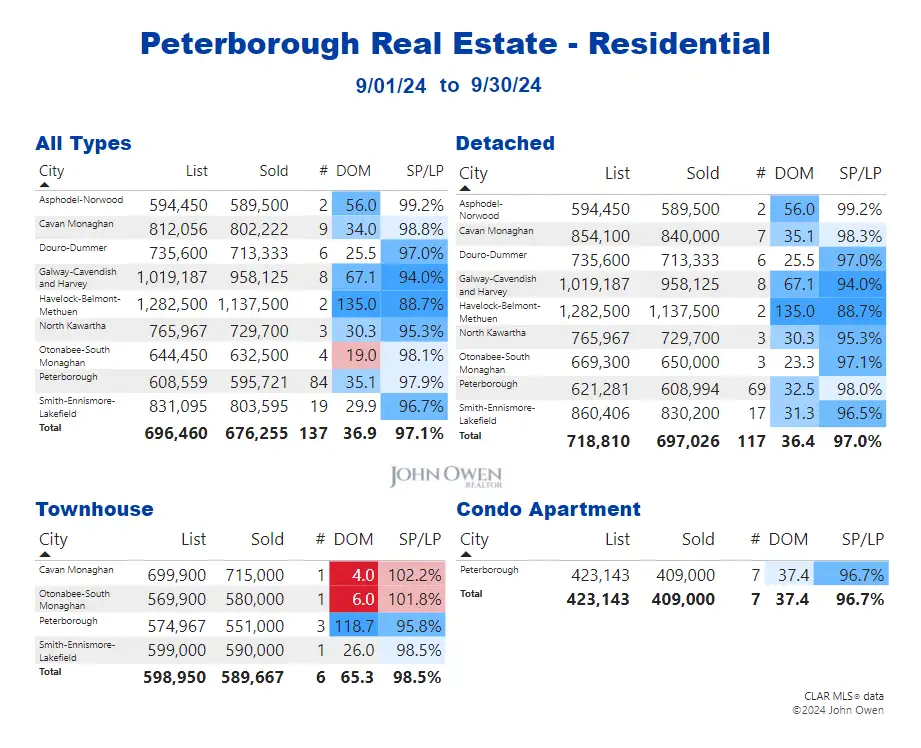
In September, home transactions reported had selling prices averaging 676,255 in the Peterborough region, with the average property selling at 97.1% of list price (SP/LP). This is a 2.9% increase from last month and is down 5.3% from last September.
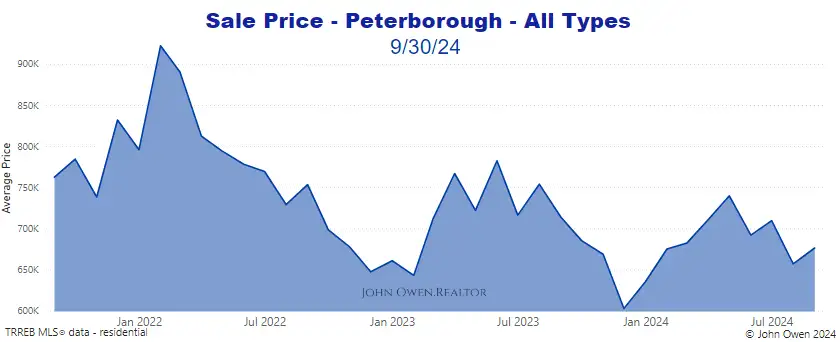
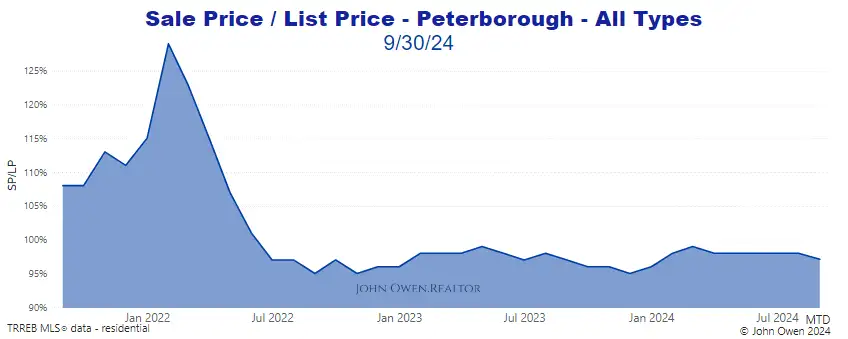
Here is a look at the average selling price monthly over the past three years. Sale prices rose sharply from the low in January of 2024 until May then dropped off since, with a rebound this month.
The following chart shows average daily selling prices for detached homes across Peterborough in the past 60 days.
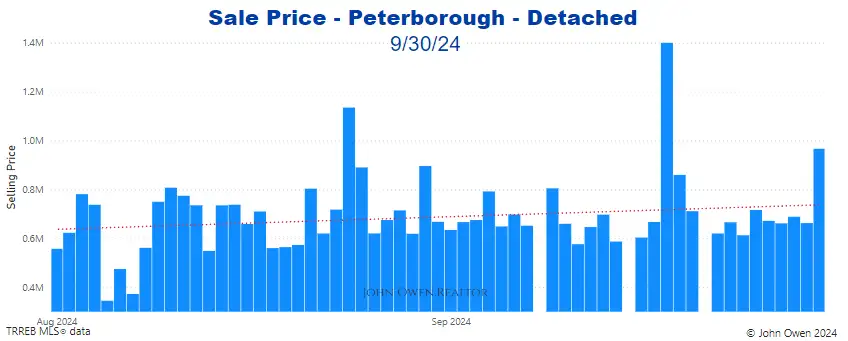
The average selling price of detached homes in the Peterborough region this month is just above 695,000.
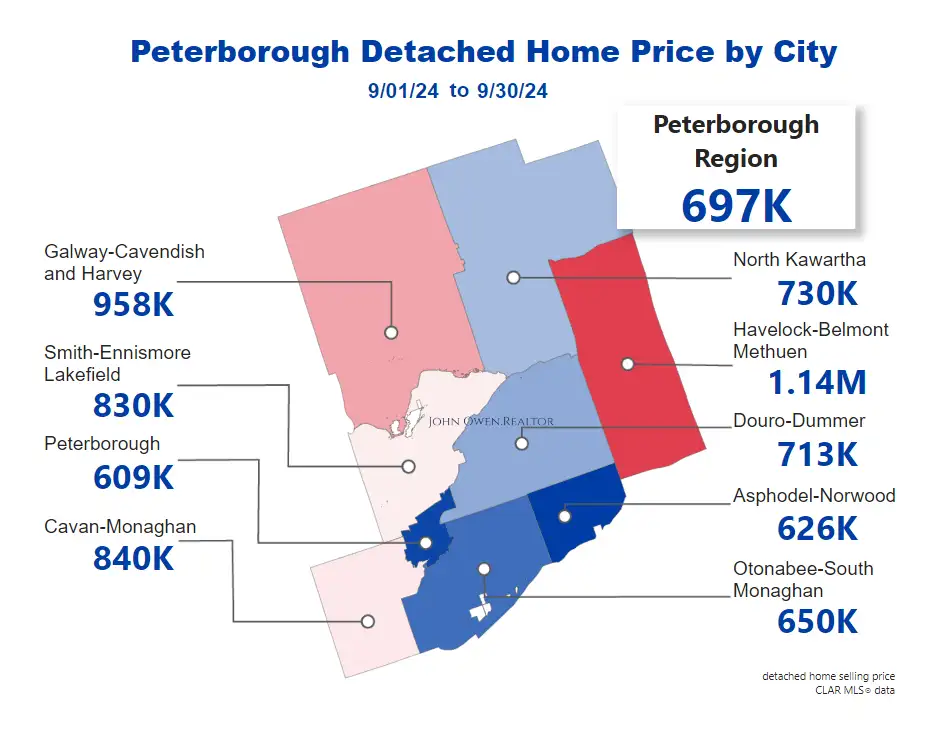
The selling price to list price ratios in most Peterborough communities show figures close to 97%, as shown in the table at the top of the page.
The recent volatility in average sales price shows how much interest rate hikes have cut into buyer budgets. They are still active, just not buying higher-priced homes to the same degree. This provides a good opportunity for those interested in buying at the higher end of the market.
There are still some listings at lower price points being posted with offer dates, where no offers will be considered until that date. This is intended to pressure buyers (given the relative shortage of listings) and generate multiple offers.
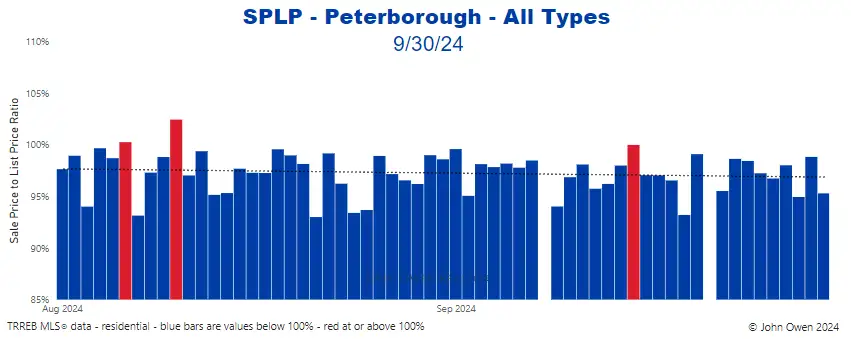
Note how the sale price to list price ratio has averaged near the 97% mark. This shows that most properties are selling without multiple offers. Note in the above chart where the red bars appear. For those days, the selling prices were above 100% - signalling that bidding situations made selling prices higher than list prices on average.
Days on market (DOM) averaged 36.9. DOM is the number of days it takes for a property to be sold firm, or without any outstanding conditions.

Should new listings rise at a pace that is faster than current sales, then there would be more inventory for the pool of buyers to choose from, which will have the effect of reducing the sale price to list price ratio, then months of inventory stat, which leans the market closer to a balanced market.
Active listings had dropped in the winter months, as is normal. They have climbed steadily since then, putting pressure on selling prices (except in the lower price ranges) amid lower buyer competition.

More active listings make all the steps taken to compete among selling properties more important. When listings were more scarce, (including now but at lower price points) buyers were compelled to reduce expectations on location, property condition, etc. In competitive situations, they may also be pressured to remove conditions on their offers.
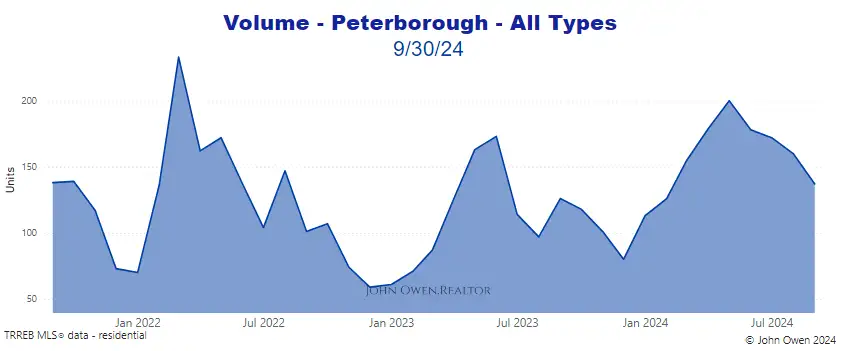
The sales rate for September has decreased by 14.4% compared to last month and is up 8.7% compared to this time last year, with a current pace of 4.6 units sold daily.
The following chart shows the daily sales volume for the past two months.
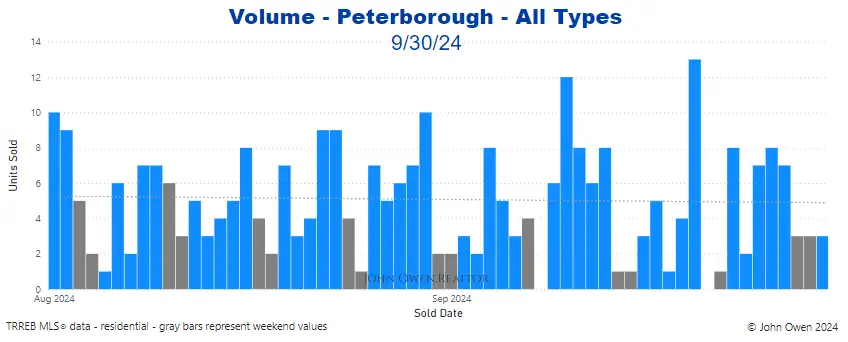
.

Buyers will still find multiple offer situations in some locations and price ranges, particularly at lower price points. They are highly advised to get prepared - have their mortgage preapproval ready before looking at homes, and be prepared to view homes via photos and virtual tours as soon as they reach the market. With interest rates being volatile, and mortgage qualification rules under review, locking in a rate is more important than ever. Speak with your agent to discuss the process to move forward.
Those considering selling should work with their agent to identify ways to set their home apart from competitive listings while reaching the widest possible audience.
If you are interested in seeing values for an area not shown or are interested in other figures, please comment below or contact me. As always, reach out anytime if you want to discuss this further without any obligation.
More Peterborough Area Real Estate Articles
Northumberland Real Estate Market Report
Peterborough Area Property Tax Rates
Durham Region Real Estate Market Report
About the Author

John Owen, Broker, RE/MAX Impact
John is an award-winning broker with RE/MAX Impact Realty and is an inductee to the RE/MAX Hall of Fame.
Office - 905-240-6777
Email - johnowen@remax.net
Member, Canadian Real Estate Association (CREA), Ontario Real Estate Association (OREA), Toronto Regional Real Estate Board (TRREB).
The recent amalgamation of the former Kawartha Lakes Association of Realtors (KLAR), Quinte & District Association of Realtors (QDAR) and Northumberland Hills Association of Realtors (NHAR) with the Durham Region Association of Realtors (DRAR) has resulted in a new, larger board representing all of these regions called the Central Lakes Association of Realtors (CLAR).
The Multiple Listing Service (MLS) for all of these regions is now hosted by the Toronto Regional Real Estate Board (TRREB) making the availability and sharing of MLS data across all of these areas much easier to access, to the benefit of buyers and sellers, and the real estate community.
Figures shown are for the following property types: detached, semi-detached, condo townhouse, condo apartment, link, att/row/townhouse, co-op apartment, detached condo and co-ownership apartment.

Comments:
Post Your Comment: