Northumberland Real Estate Market Update
Last updated March 6, 2024, at 10:30 a.m.
Read the latest market report
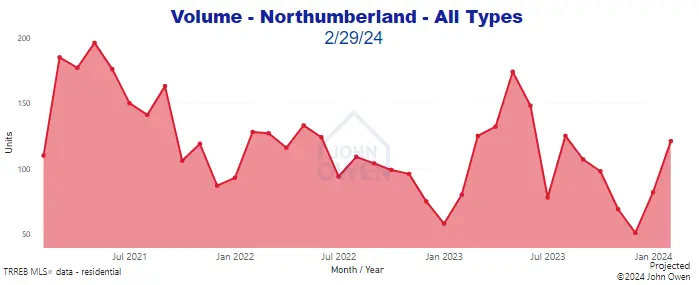
The real estate market in Northumberland is through February 2024 with balanced conditions at most price points and locations. Sales volume and inventory are climbing from December lows.

Sorry, it’s sold!
22 Daniels Drive, Brighton
$1,399,990 MLS#X8111876
One Of The Most Luxurious Homes In Brighton! Spectacular Backyard Oasis With Heated Inground Pool & Waterfall, Brick Cabana With Change Room, 3 Pc Bath, Wet Bar, Hot Tub. Meticulously Maintained Park-Like Grounds On A Private, Double Pie Lot.
More details: https://johnowen.realtor/mylistings.html/listing.22-daniels-drive-brighton.99516150
Inventory levels had been easing over the last several months, but are now picking back up. Sales volume had also slowed considerably from summer levels, and have picked up. Buyers are understandably cautious as the interest rate situation was clearly affecting buyer sentiment and budgets, though improved confidence is showing in the Durham and Toronto area markets, which typically spill over into Northumberland.
Mortgage rates are still very high compared to just a couple of years ago, though they are down some, making getting a mortgage pre-approval (and rate lock) essential for buyers who haven’t purchased yet. The announcement by the Bank of Canada on March 6, 2024 to hold the overnight rate was in-line with expectations. It is widely expected to begin lowering rates in the coming months.
Northumberland Real Estate Market February 2024
Supply levels vary throughout the region, with 3.1 months of inventory (MOI) for the entire area. This means that at the current pace of sales, with no new listings, all inventory would be sold within this time frame. There are higher levels in some communities.
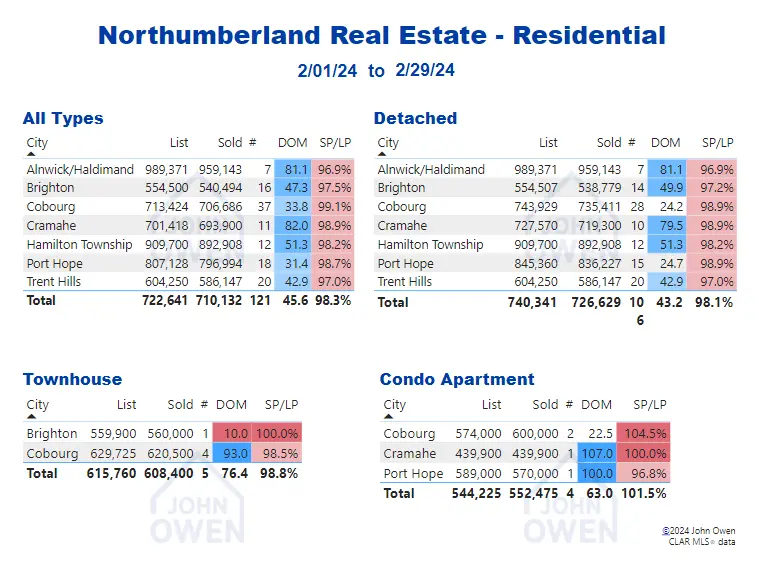
In February, residential transactions reported thus far had selling prices averaging 710,132 in Northumberland, with the average property selling at 98.3% of list price (SP/LP). This is a 0.1% increase from last month and is up 4.6% from last year.
Here is a look at average home selling prices each month over the last three years: Prices climbed at a healthy pace over the first several months of last year, then fell through September before climbing in October and November before falling off in December then climbing again in January.
The following chart shows average daily selling prices for detached homes across Northumberland in the past 90 days.
The average selling price of detached homes so far this month is just over 725,000.
The selling price to list price ratios in most Northumberland communities show figures close to 98%, as shown in the table at the top of the page. This is getting close to the 100% mark, showing that buyers are more active, and multiple offer situations are working into the mix.
One clear sign that conditions have become more seller favouring is the increase of listings with offers being held to a specific date. This strategy is intended to pressure buyers (when there is a perceived shortage of listings) and to generate multiple offers. Watch for these to increase, especially in Port Hope and Cobourg, and at lower price points.
Also, the sale price to list price ratio has averaged near the 98% mark. This shows that most properties are selling without multiple offers. Note in the above chart where the red bars appear. For those days, the selling prices were above 100% - signalling that bidding situations made selling prices higher than list prices, on average.
Days on market (DOM) averaged 45.6. DOM is the number of days it takes for a property to be sold firm, or without any outstanding conditions.
This figure had dropped substantially since the beginning of last spring and had been heading higher over the summer. It has risen again since then.
Should new listings rise at a pace that is faster than current sales, then there would be more inventory for the pool of buyers to choose from, which will have the effect of reducing the sale price to list price ratio, then months of inventory stat, which leans the market closer to a balanced market.
Active listings had dropped in the winter months last year. They climbed steadily until summer, putting pressure on selling prices. They dropped over the fall months and are starting to climb again.
More active listings make all the steps taken to compete among selling properties more critical. When listings were more scarce, (including now but at lower price points) buyers were compelled to reduce expectations on location, property condition, etc. They also may have pressure in competitive situations to remove conditions on their offers.
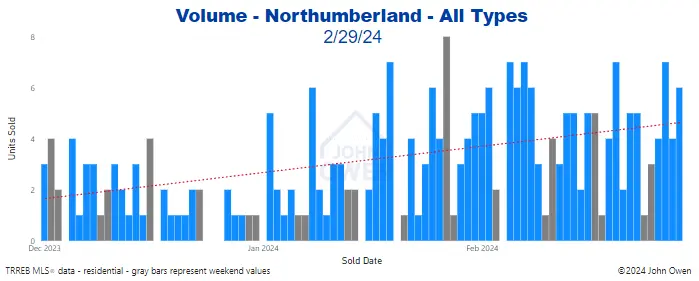
The sales rate for February has increased by 47.6% compared to last month and is up 51.3% compared to this time last year, with a current pace of 4.2 units sold daily.
The following chart shows the daily sales volume for the past 3 months.
.
Buyers will still find multiple offer situations in some locations and price ranges, particularly at lower price points. They are highly advised to get prepared - have their mortgage preapproval ready before looking at homes, and be prepared to view homes via photos and virtual tours as soon as they reach the market. With interest rates being volatile, and mortgage qualification rules under review, locking in a rate is more important than ever. Speak with your agent to discuss the process to move forward.
Potential sellers should be working with their agent to identify ways to set their home apart from competitive listings while reaching the widest possible audience.
If you are interested in seeing values for an area not shown or are interested in other figures, please comment below or contact me. As always, give me a call anytime if you would like to discuss this further without any obligation.
More Northumberland and Area Real Estate Articles
Peterborough Region Real Estate Market Report
Durham Region Property Tax Rates - GTA and Ontario
Northumberland Real Estate Market Report - January 2024
About the Author
John Owen, Broker, RE/MAX Impact
John is an award-winning broker with RE/MAX Impact Realty and was their number-one agent in GCI for 2022.
Direct - 905-434-0067
Email - johnowen@remax.net
Member, Canadian Real Estate Association (CREA), Ontario Real Estate Association (OREA), Toronto Regional Real Estate Board (TRREB).
The recent amalgamation of the former Quinte & District Association of Realtors (QDAR) and Northumberland Hills Association of Realtors (NHAR) with the Durham Region Association of Realtors (DRAR) has resulted in a new, larger board representing all of these regions called the Central Lakes Association of Realtors (CLAR).
The Multiple Listing Service (MLS) for all of these regions is now hosted by the Toronto Regional Real Estate Board (TRREB) and will make the availability and sharing of MLS data across all of these areas much easier, to the benefit of buyers and sellers, and the real estate community.
Figures shown are for the following property types unless otherwise specified: detached, semi-detached, condo townhouse, condo apartment, link, att/row/townhouse, co-op apartment, detached condo and co-ownership apartment.


Comments:
Post Your Comment: