


As the summer real estate market hit its mid-point in Durham Region, we saw a continued level of buyer activity that traditionally tapers well off after the spring peak. Although volume levels did drop from June, as is typical in the seasonal cycle, they were well up year-over-year.
Pricing was down monthly, consistent with the normal seasonal pattern, but not in all areas. We saw annual increases in virtually all areas of Durham.
The GTA overall showed a similar pattern of dips in price and volume from June. Not to say things are slowing, as both volume and prices are up on an annual basis.
There has been price pressure on detached homes, as the mortgage stress test continues to take its toll on buyer qualifications on higher-priced properties. As a result, we saw prices of townhomes increasing due to affordability and demand for family properties. Condos were down in price in most areas.
Price
Prices in Durham Region increased 3.6% from July 2018 and dipped 2.5% since June 2019. The overall The Toronto Real Estate Board's (TREB) market posted a 3.1% annual increase (-3.1% monthly).
Average prices for all of TREB were 806,755 as shown in the above chart (red line). The seasonal winter and summer dips are clearly visible in the TREB price line (though the spring jump hit earlier than normal).
Durham Region (blue line) prices showed a yearly increase, though with much less seasonal volatility than the TREB numbers showed in the seasonal trends.
The latest market statistics show the average Durham property at $604,938 - down from last month's 620,506 by $15,568 (-2.5%).

Inventory
Active listings in Durham Region were 2176 in July. That is a 0.8% decrease from last year and a 6.2% decrease from June. This monthly decrease in active listings isn't keeping pace with sales, increasing buyer competition and will help to drive prices higher at a moderate pace.
The overall TREB market had a 8.7% drop in active listings from June.
Demand
Sales volume in Durham Region increased 31.1% from last year with 1041 units sold versus 794 last July (TREB +23.5%). It was down, as is expected seasonally, from June by 4.8%. (TREB -3.0%).
The time a property takes to sell is called DOM or days on market. It was 23 in July, showing a very good pace to sales, especially for summer. This figure tends to increase after the spring market before dropping again in the fall.
Another indicator of demand is sale price compared to list price. It was 98% in Durham in July, again showing high levels of buyer demand.
These factors combined are a good barometer for sellers, as it shows that not only is current inventory moving at a good pace, but it is also selling at a price that is very close to asking.
Prices By Home Style
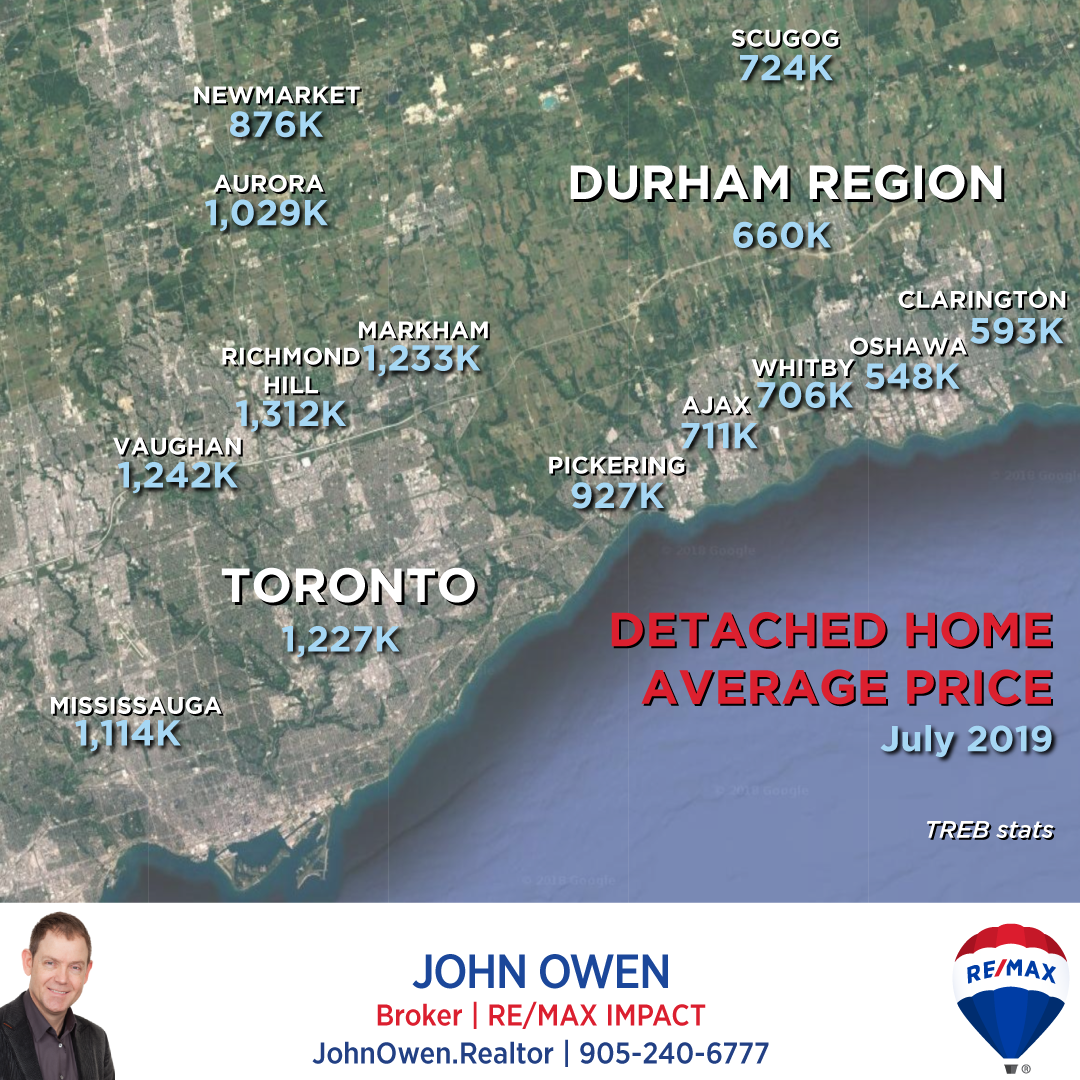
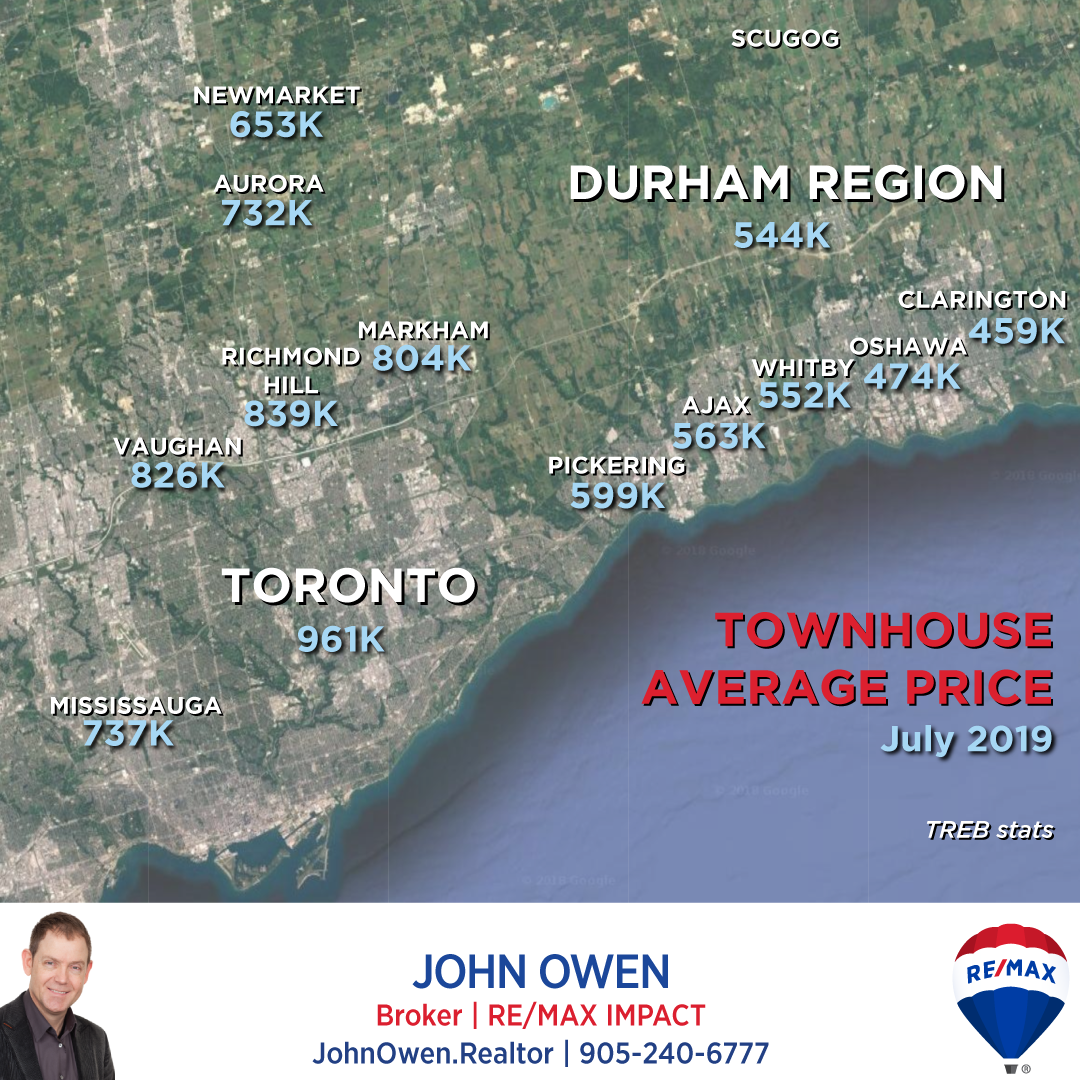
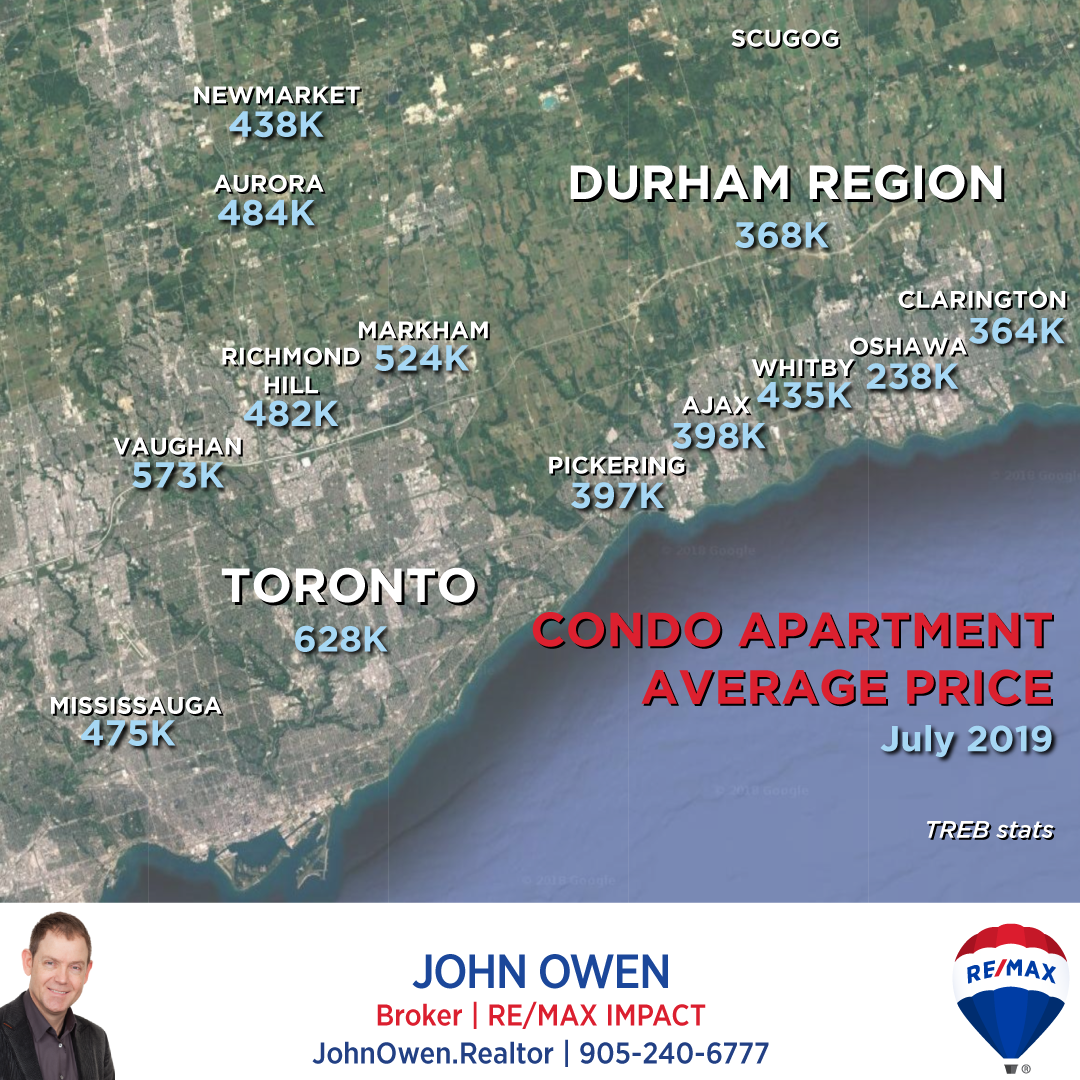
What are homes selling for in Durham Region Cities?
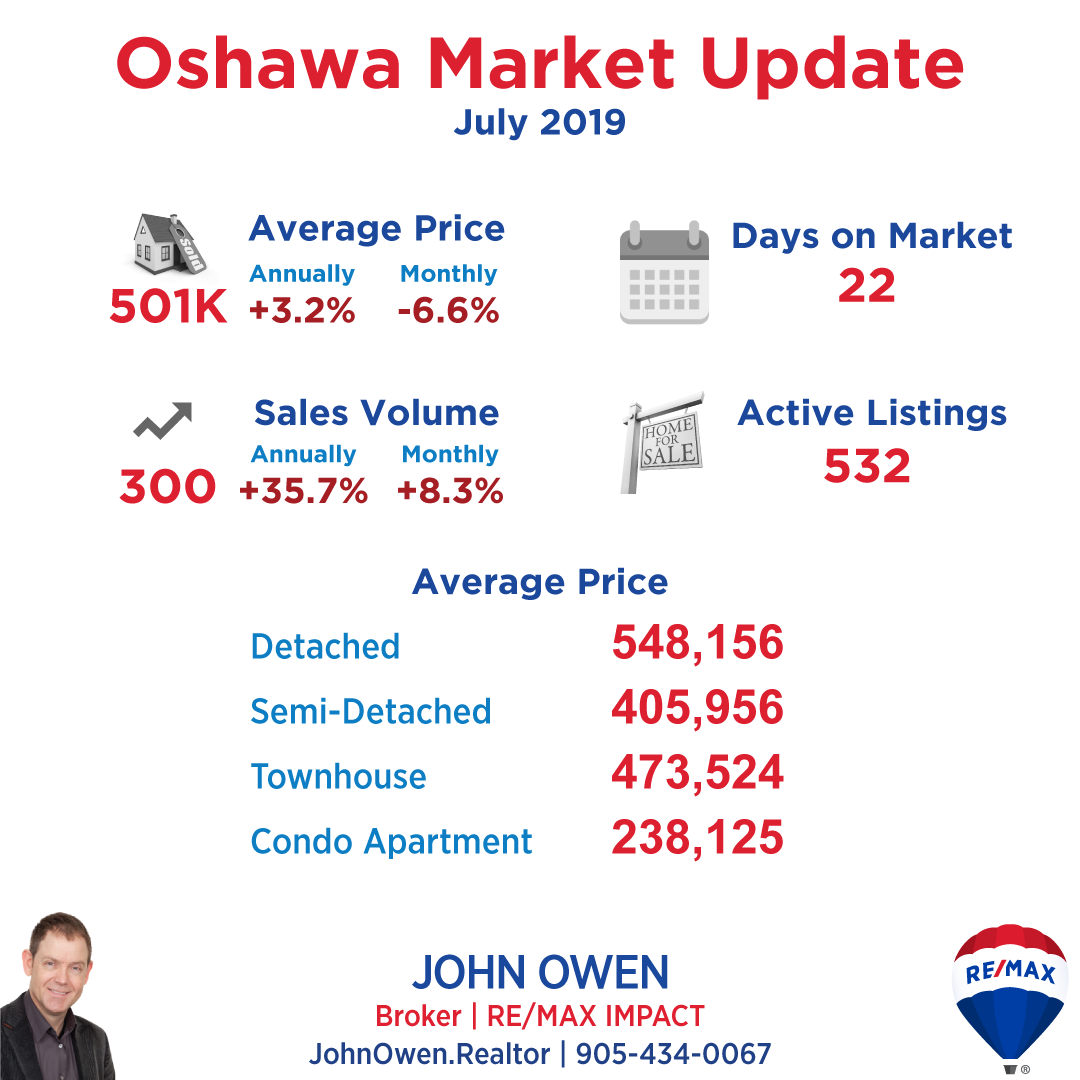
Oshawa showed a very strong performance versus seasonal norms in July. Sales volume was way up from June (+8.3%) and 2018 (+35.7% annual change). Prices were down since June (-6.6%) and (+3.2%) year-over-year.
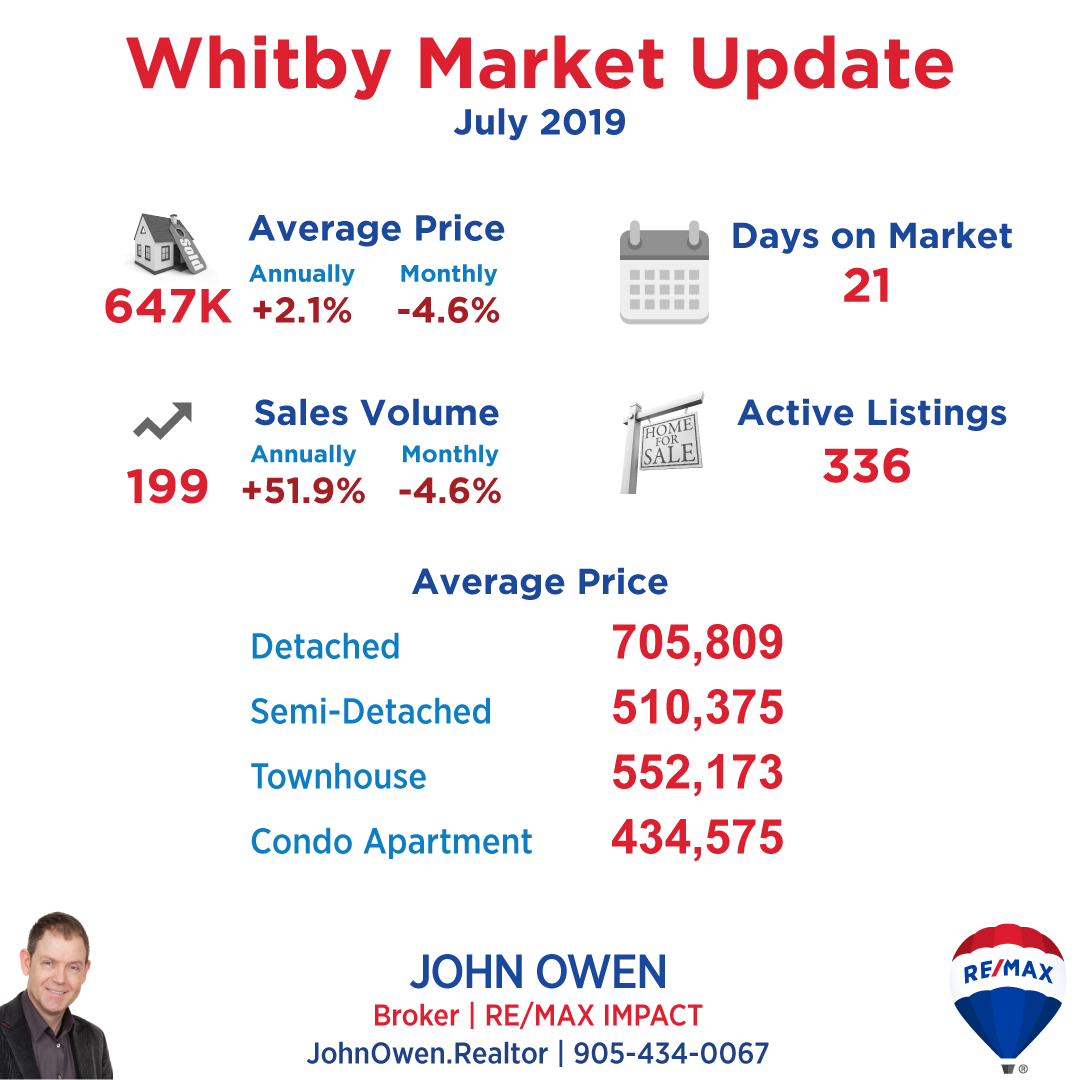
Whitby had a seasonal dip in sales volume from June (-4.6%) but was well up from last year (+51.9%). Prices were down (-4.6%) from June and up (+2.1%) annually.
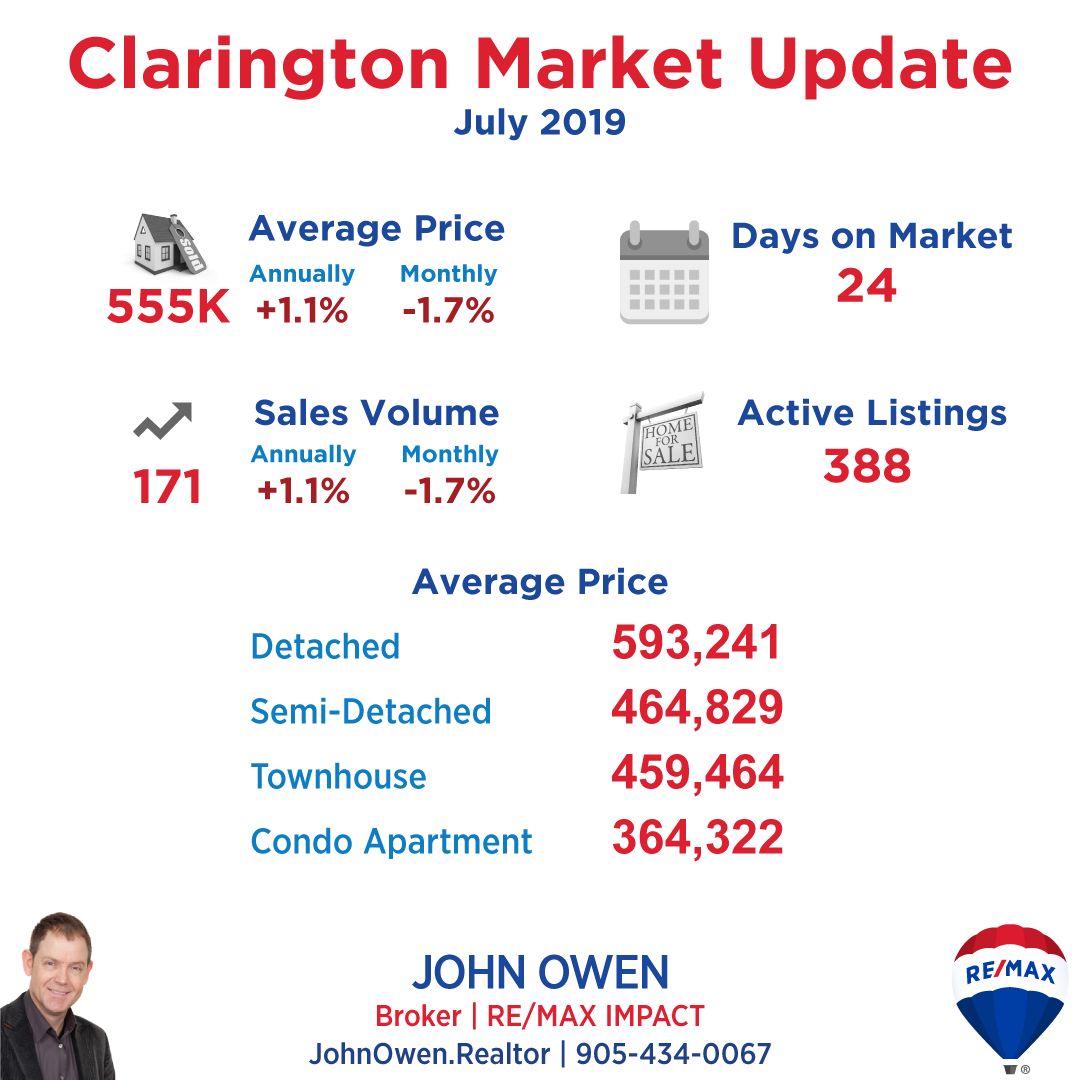
Clarington's sales volume dipped (-1.7%) monthly, and was up (+1.1%) annually. Prices were up (+1.1%) annually but dipped slightly (-1.7%) monthly.
This is a good opportunity for buyers looking for a detached home who may have missed out earlier in the spring, as prices on these homes have dropped. Given the pace of the local market, things may head back upward again soon, unless new listings continue to keep pace with sales.
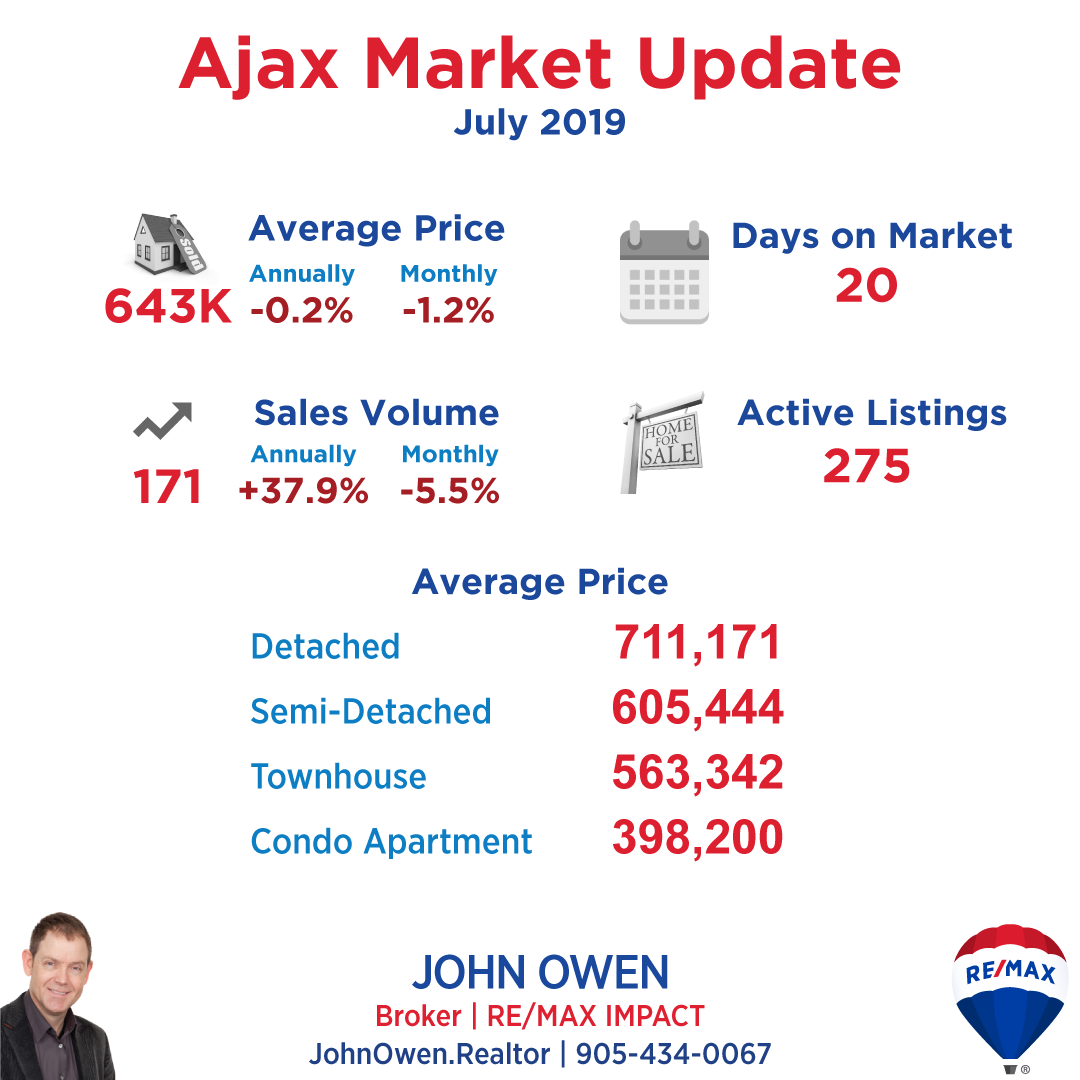
In Ajax, volume was up (+37.9%) annually and down (-5.5%) monthly. Prices dropped (-0.2%) annually in Ajax and dipped (-1.2%) monthly.

Pickering was down in volume monthly (-2.3%) and was up (+11.0%) year-over-year. It had a large jump in price (+11.0%) annually and also (+8.3%) monthly.
If you are interested in seeing values for an area not shown or are interested in other figures, please comment below or send me an email - John@JohnOwen.Realtor As always, give me a call anytime if you would like to discuss further without any obligation.
Older Reports
June 2019
Member, Canadian Real Estate Association (CREA), Ontario Real Estate Association (OREA), Toronto Real Estate Board (TREB).


Comments:
Post Your Comment: