


As summer heats up, Oshawa's real estate market is cooling down from one of the hottest spring markets ever. A surge in inventory has helped to temper the demand that seemed insatiable just a few months ago. It posted very humble 11.1% average annual price gain in June 2017.
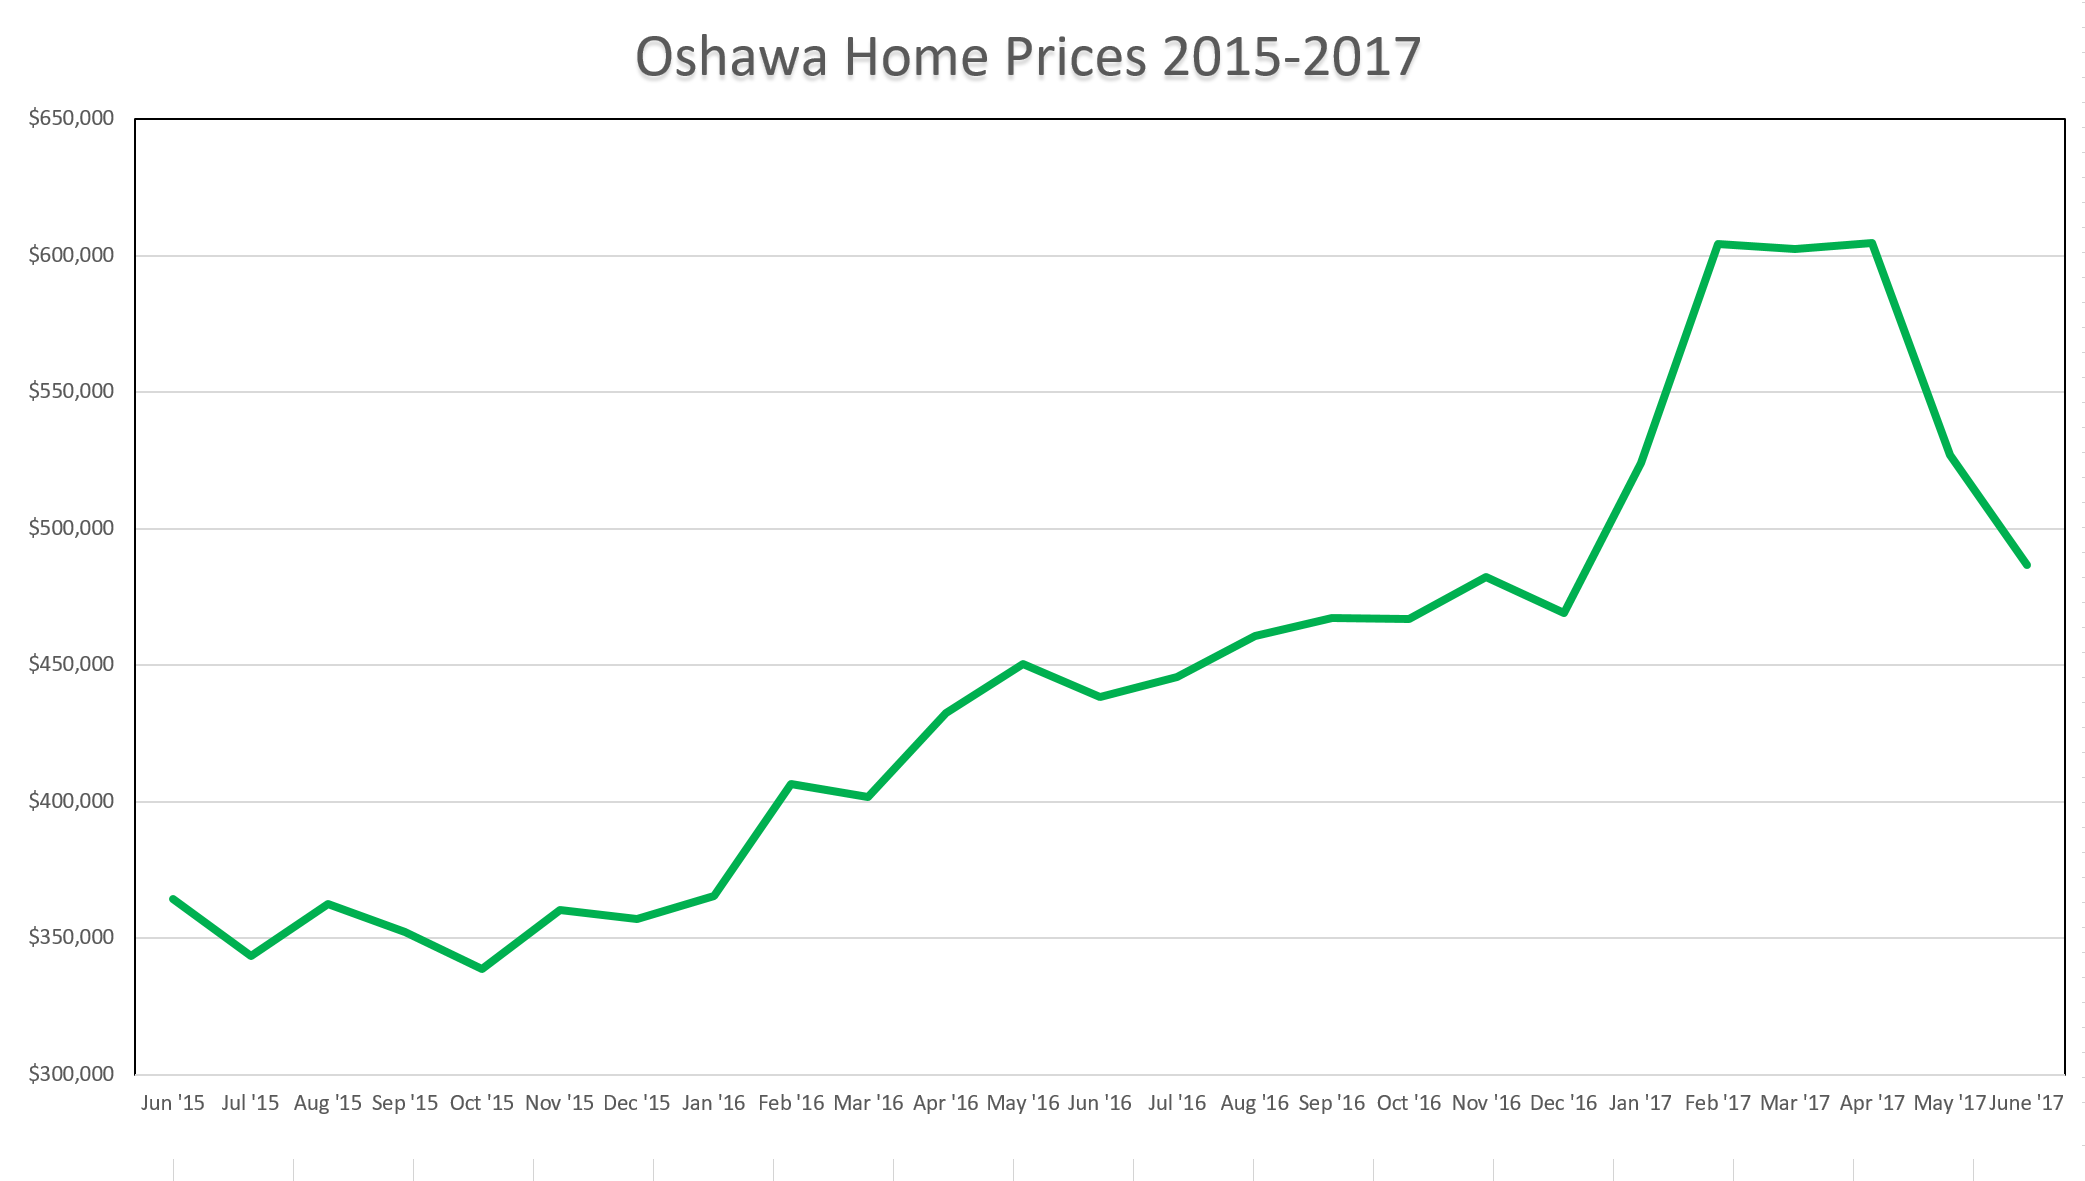
Average prices have come down substantially since the spring peak, as shown in the following chart:

The Toronto Real Estate Board's (TREB) latest market statistics show the average Oshawa property at $486,555 - up from last year's 437,835, but down from last month's 526,774. Sales volume, however, was down 28.2% with 293 units sold versus 408 last June.

The average selling price of homes in the GTA this June was $793,915. This represents a 6.3% increase over 2016. Sales volume was down 37.7% and new listings shot up 15.9% over last year.
Inventory - Driving the Current Price Changes
Active listings within the board increased 59.6%, which shows a shift in market fundamentals. The jump in inventory is helping to make the market more balanced - more inventory means less bidding wars as supply rises.
In Oshawa, the increase was 40% with 661 active listings over 472 last year. This helps to explain why prices dropped from spring levels.
The increase still isn't enough to make it a buyer's market, though. The average property in Oshawa still sold for 101% of asking. That's still better than the entire GTA - at 100%, and is partly due to Oshawa still having the lowest average prices in the market.
While inventory levels did increase, the levels are still low. The current trend shows only 0.8 months of inventory.
What are homes selling for in Oshawa?

The MLS Home Price Index helps to normalize the statistics, by adjusting sales statistics to represent typical homes within MLS areas. When using these numbers, Oshawa showed a composite annual gain of 33.83%, compared to the TREB average of 25.33%.
Inventory levels continue at low levels with 1.2 months of inventory on hand across the board. This means that a current sales levels, all of the property would be bought up in the GTA in 1.2 months (if no new listings were added). Many areas within the GTA have similar figures, but unsurprisingly to those who read my reports, Durham Region still has the lowest inventory in the entire area. Overall, there is only 0.9 months inventory in the area. In Oshawa, there is just 0.8 months inventory. Some home price ranges and types are still experiencing bidding wars.
The average listing in Oshawa spent 13 days on the market. The TREB average was 15 days.
If you are interested in seeing values for an area not shown, or are interested in other figures, please comment below or send me an email - John@JohnOwen.Realtor As always, give me a call anytime if you would like to discuss further without any obligation.
Older Reports
Member, Canadian Real Estate Association (CREA), Ontario Real Estate Association (OREA), Toronto Real Estate Board (TREB).


Comments:
Post Your Comment: