

Durham Region's real estate market is showing promise for a busy spring as a balance of inventory and price stability provide a calming effect on a large group of buyers.
Prices are trending upward over February, and there is more inventory for buyers in a stark contrast from last year's craziness where scant inventory led to frenzied bidding wars across the region.
Durham Region prices dropped 14.3% compared to March of 2017, but they increased 1.2% over February 2018 levels. Making comparisons to last year isn't reflective of a typical sales cycle, however, as prices, volume and days on market were all well off norms through the end of spring last year.
Average prices for all of TREB are still higher than August's low, as shown in the following chart (burgundy line), though the numbers since October are following a more typical price trend that we saw in the previous year (as prices were mostly rising regardless of season). Most of the areas in Durham Region (blue line) and Oshawa (purple) have increased since their low point in July, with varying performance since then.
Oshawa is at a high point since it's July low, showing good price performance compared to most GTA cities over the same period.

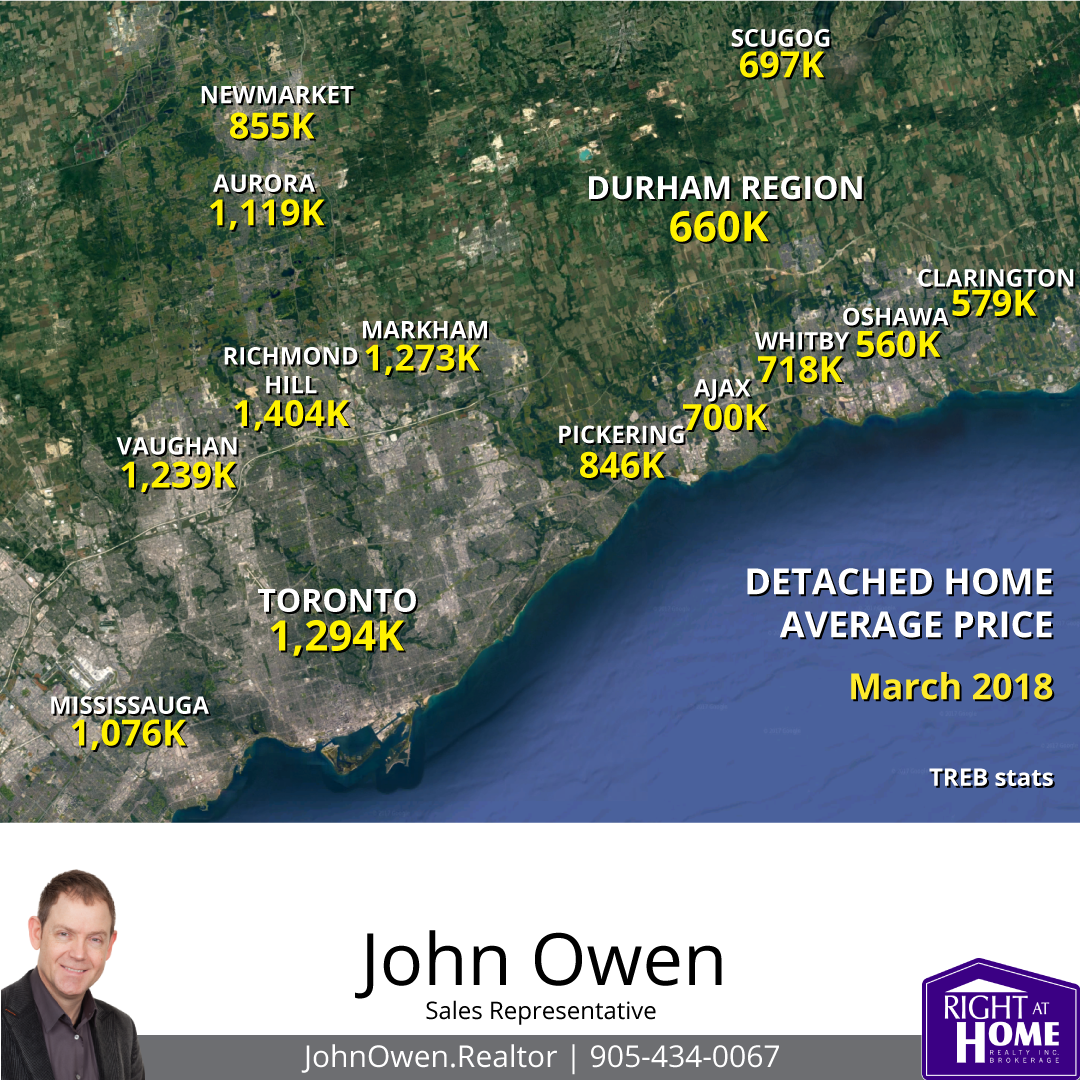
The Toronto Real Estate Board's (TREB) latest market statistics show the average Durham property at $598,412 - up from last month's 591,404 by $7,008.
Sales volume fell 37.3% with 846 units sold versus 1349 last March, but well up from last month, when there were 604 transactions.

The average selling price of homes in the GTA this March was $814,642. This represents a 9.4% decrease since March 2017. Sales volume was down 34.3%.
Inventory - Balance Brings Back Negotiating
Active listings within the board increased 46.1%, which shows a shift in market fundamentals. The jump in inventory is helping to make the market more balanced - more inventory means less bidding wars as supply rises.
In Durham, the increase was 144.5% with 1660 active listings over just 679 last year. This helps to explain why prices dropped from last year's levels.
The increase still isn't enough to make it a buyer's market, though. The average property in Durham still sold for 99% of asking. That's still close to being on par with the entire GTA, and is partly due to Durham having the lowest average prices in the region.
The current trend shows 2.0 months of inventory.
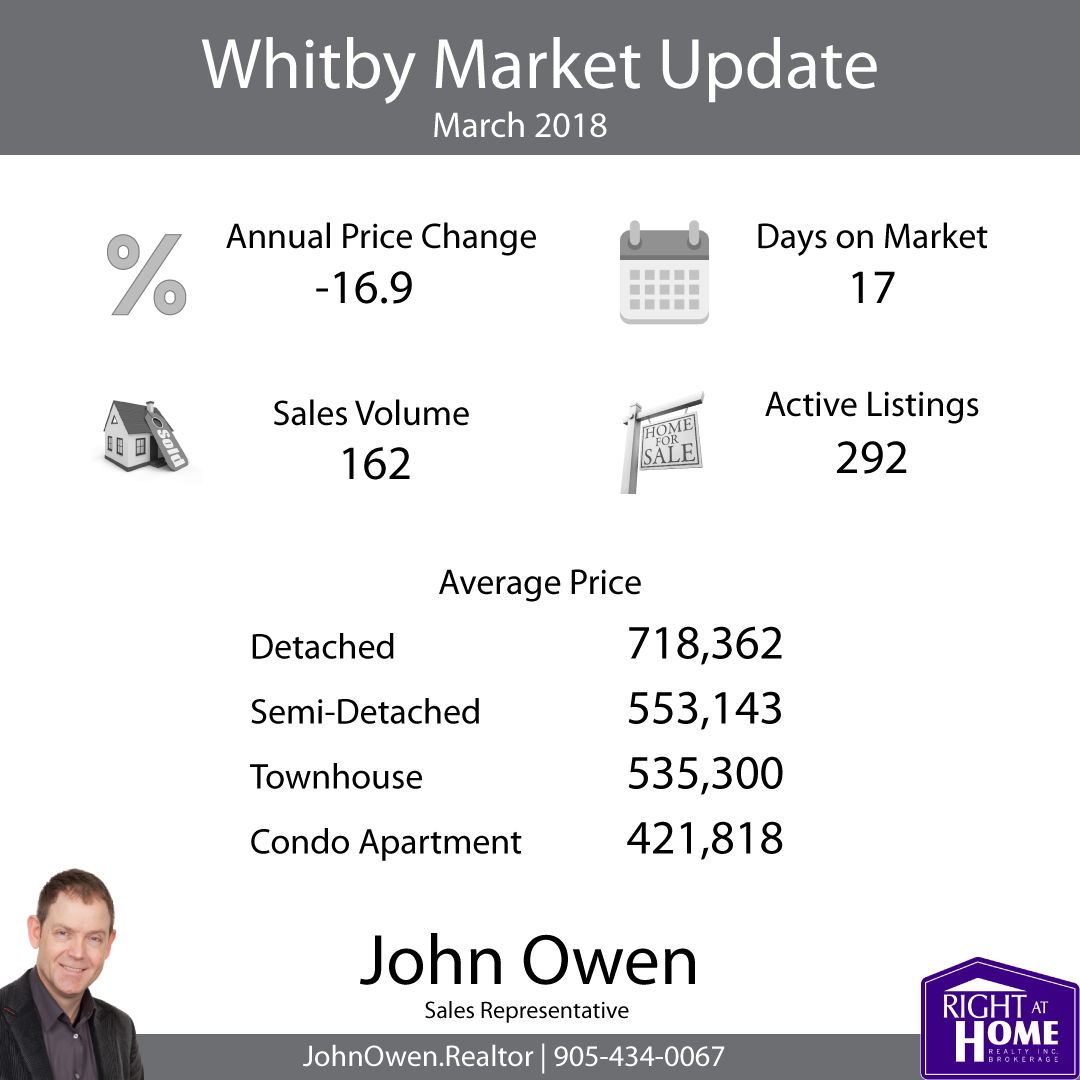
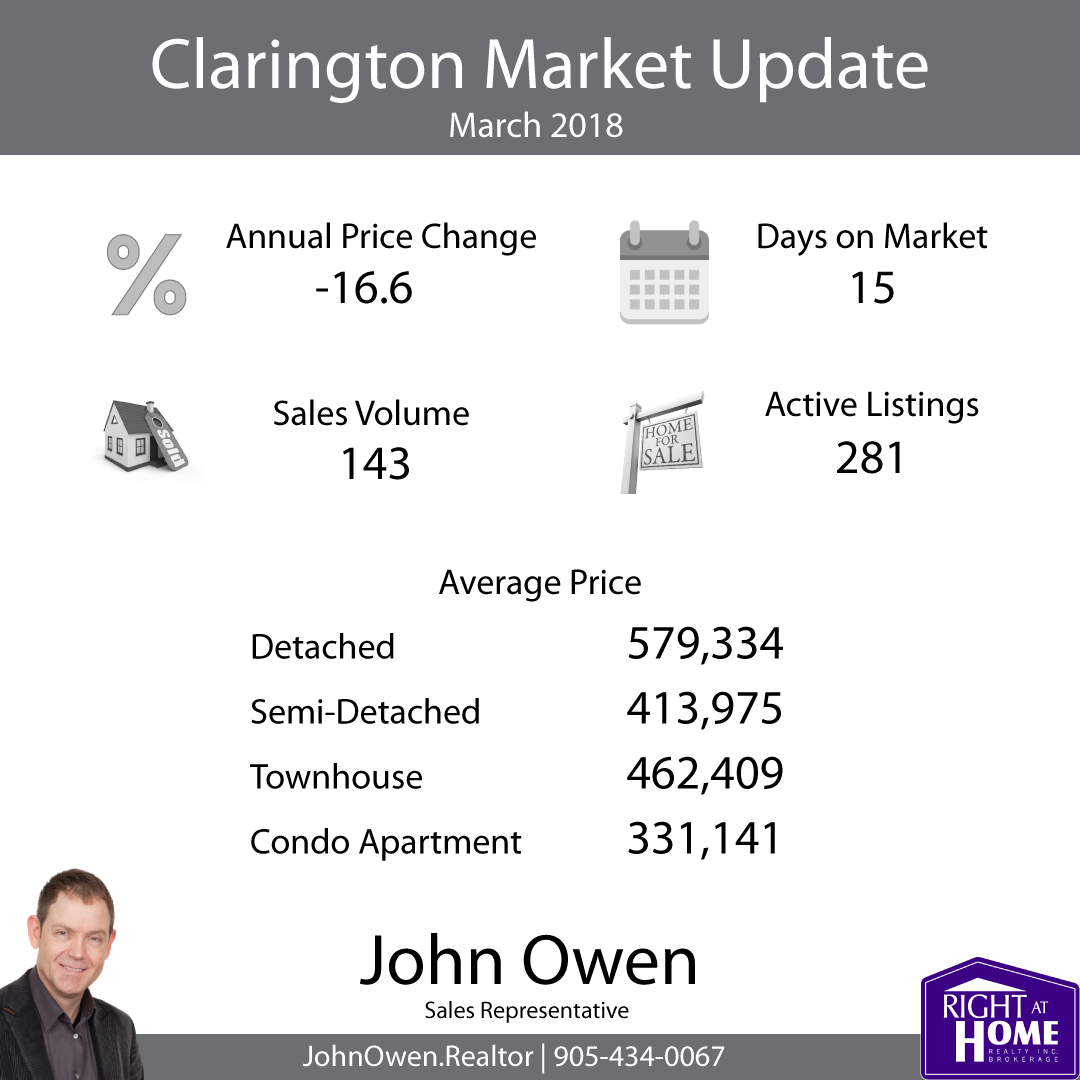
What are homes selling for in Durham Region Cities?
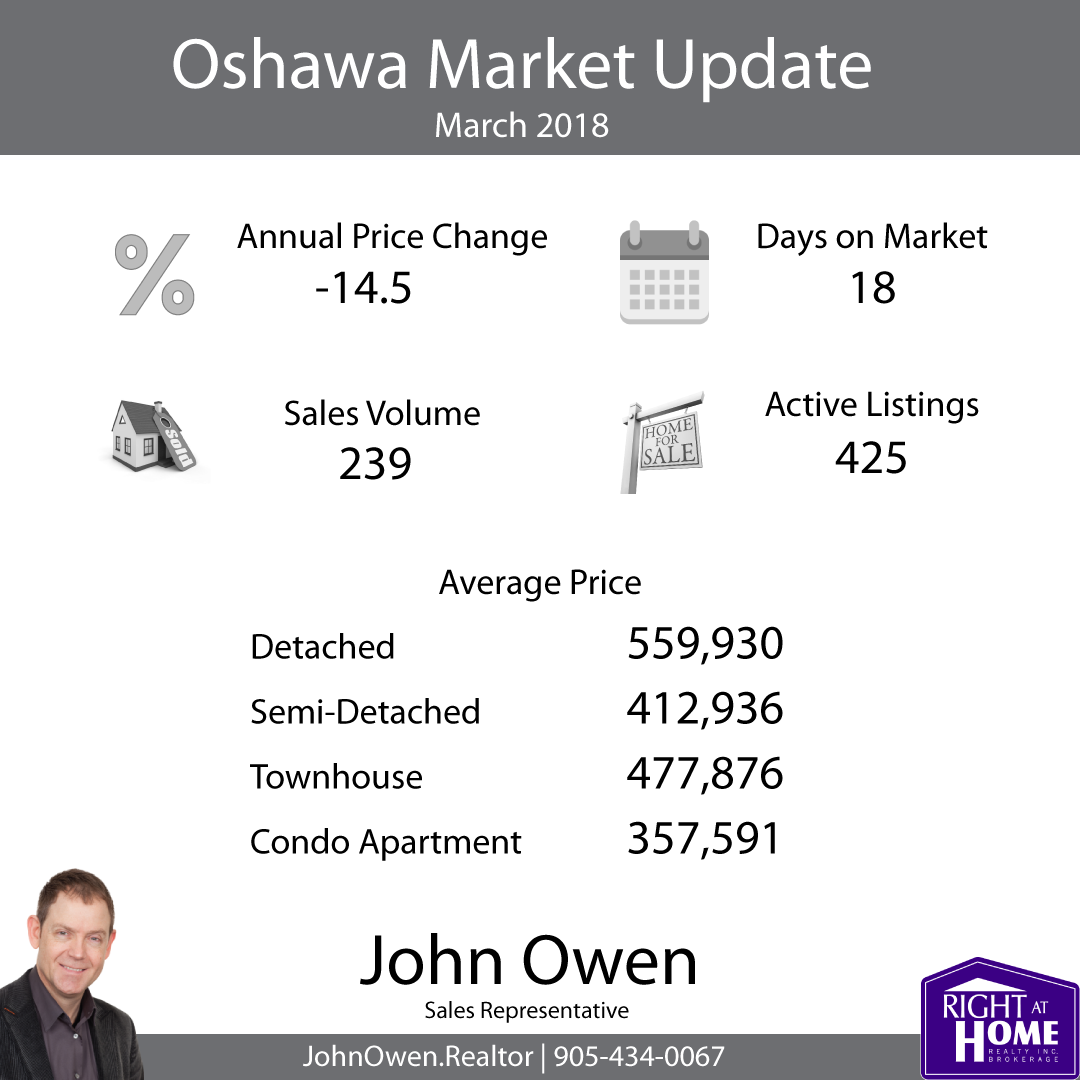
The MLS Home Price Index helps to normalize the statistics, by adjusting sales statistics to represent typical homes within MLS areas. When using these numbers, Oshawa showed a composite annual drop of 1.86%, compared to the TREB average of -1.5%.
Inventory levels continue at moderate levels with 1.8 months of inventory on hand across the board. This means that a current sales levels, all of the property would be bought up in the GTA in 1.8 months (if no new listings were added). In Durham, there is 2.0 months inventory.
The average listing in Durham spent 18 days on the market. The TREB average was 17 days.
If you are interested in seeing values for an area not shown, or are interested in other figures, please comment below or send me an email - John@JohnOwen.Realtor As always, give me a call anytime if you would like to discuss further without any obligation.
Older Reports
Member, Canadian Real Estate Association (CREA), Ontario Real Estate Association (OREA), Toronto Real Estate Board (TREB).


Comments:
Post Your Comment: