


Durham Region Real Estate Daily Market Update
Last updated March 31, 2026, 10:10 a.m.
The Durham Region real estate market is favouring sellers overall as we reach the end of March 2026. Sales volume and inventory are rising, with increased buyer competition at some price points and locations.
Mortgage Rates and Market Dynamics:
Lower Mortgage Rates: Lower mortgage rates have increased buyer confidence and activity. Unrest in the Middle East may drive rates higher in the near future, however.
Inventory Levels: Higher inventory levels relative to sales volume have created a more balanced market, with some segments selling quickly due to high demand and low supply.
Seller's Strategy for Early Spring 2026:
Realistic Pricing: Sellers, especially in higher price ranges, northern areas, and condos, should price properties competitively. With fewer multiple offers, realistic pricing is key.
Market Presentation: A strategic approach to presentation and exposure is crucial to attract potential buyers.
Sales and Inventory Trends:
Sales Volume: Sales levels are beginning to pick up, in line with seasonal trends. Homes in higher price ranges are now getting more showings and sales.
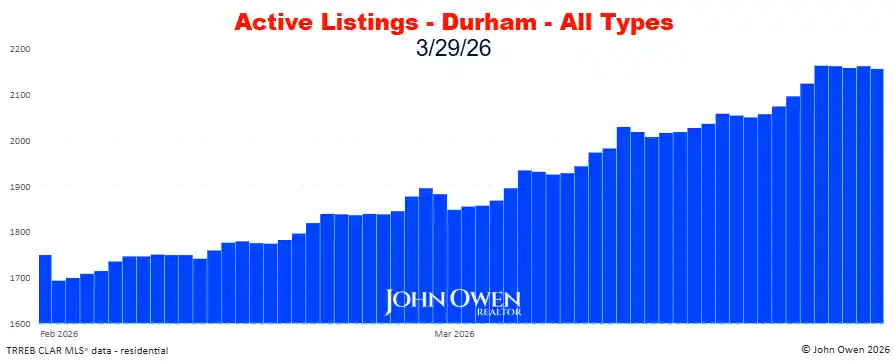
Inventory: Listing levels are climbing after seasonal lows. The selection of listings out there for buyers will continue to rise in the coming weeks.
Current Market Conditions:
Multiple Offers: Fewer properties are being sold with multiple offers, but there are offer holds on some listings and price points.
Price Alignment: Selling prices align relatively closely with list prices, showing a competitive yet balanced market. Selling prices relative to list price are averaging below list price consistently, though there are exceptions.
Interest Rate Movements:
Bank of Canada's Overnight Rate: The benchmark rate was held at 2.25% on March 18, 2026. The current rate is down by 2.75% from the 5.0% rate in April of 2024. The next announcement is scheduled for April 29.
Five-year insured fixed mortgages are now being offered as low as 3.69%. Five-year insured variable rates are now as low as 3.30%.
By keeping on top of these market trends, buyers and sellers in Durham Region can make informed decisions in the early spring real estate market.
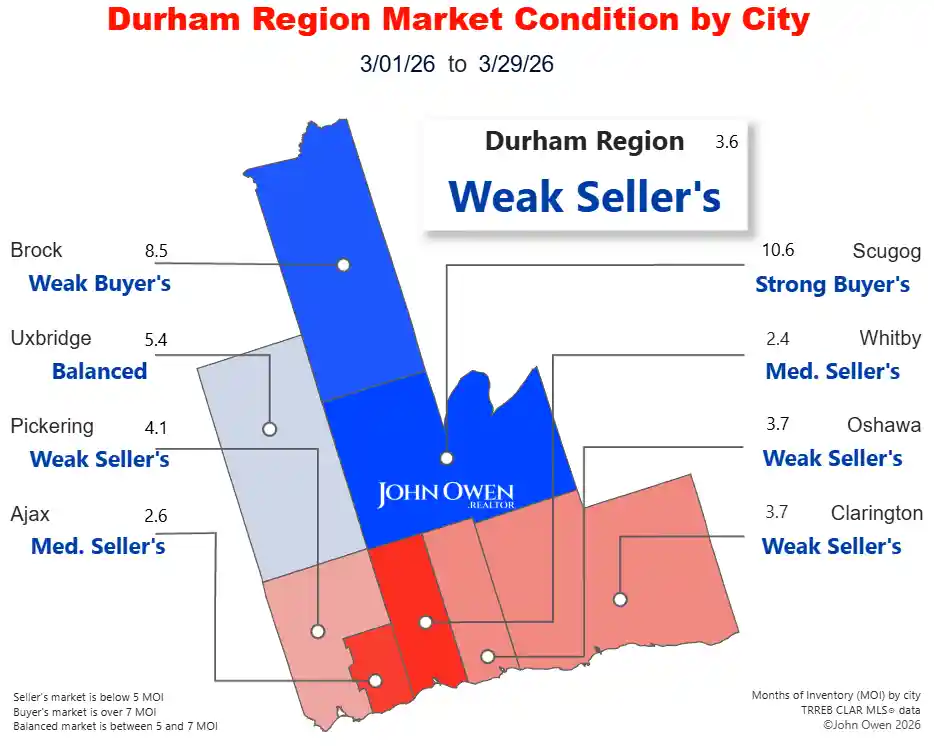
Supply ranges from low to moderate, with 3.6 months of inventory (MOI) for the entire region. At the current pace of sales, with no new listings, all inventory would be sold within this time.
Durham Region Real Estate Market March 2026
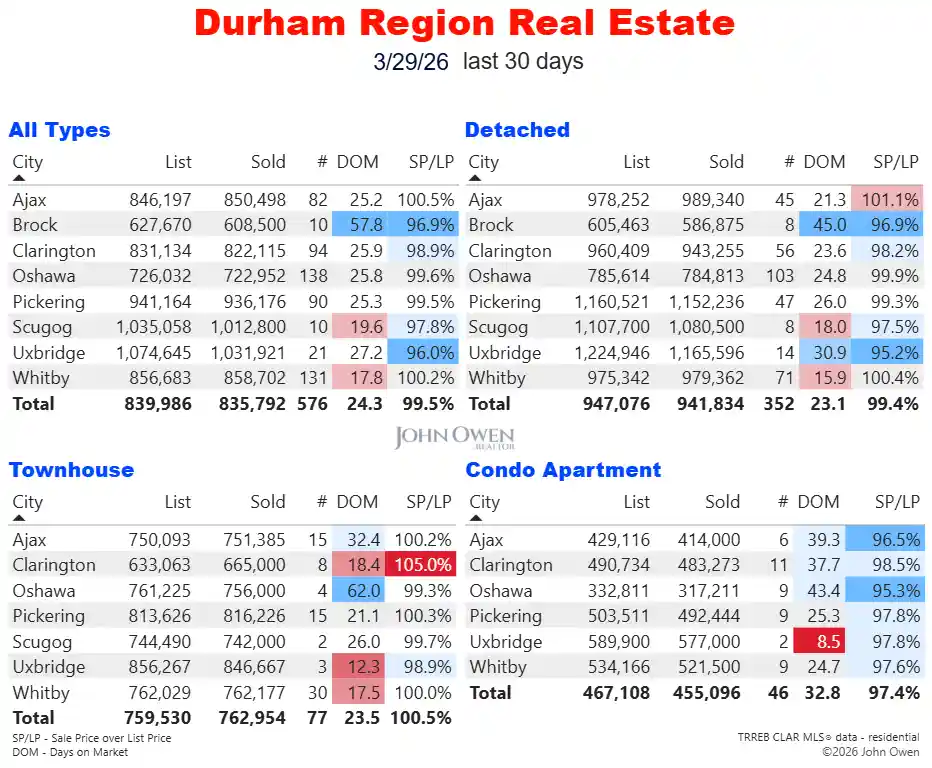
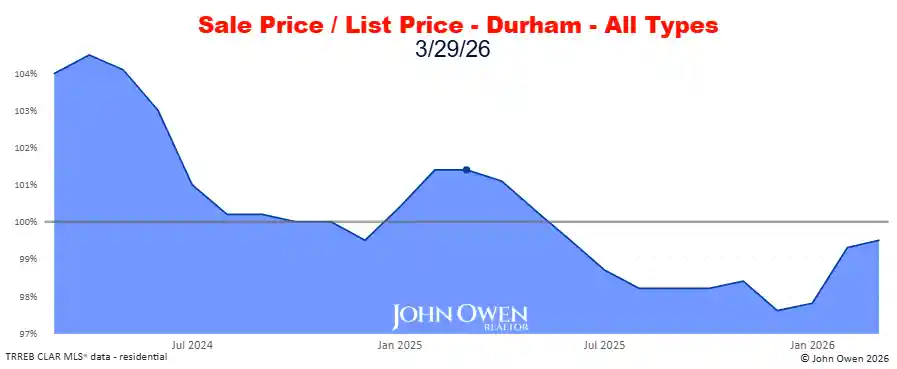
In March, transactions for all types of residential properties reported thus far had sale prices averaging 835,792 in Durham Region, with the average property selling at 99.5% of list price (SP/LP). This is down 1.0% from last month and down 7.7% from last March.
Durham Region currently leads the Greater Toronto Area based on buyer competitiveness and activity (highest sale price to list price ratio, lowest days on market) and affordability (lowest average sale price).
Here is a chart showing the average daily selling price of detached homes over the past two months.
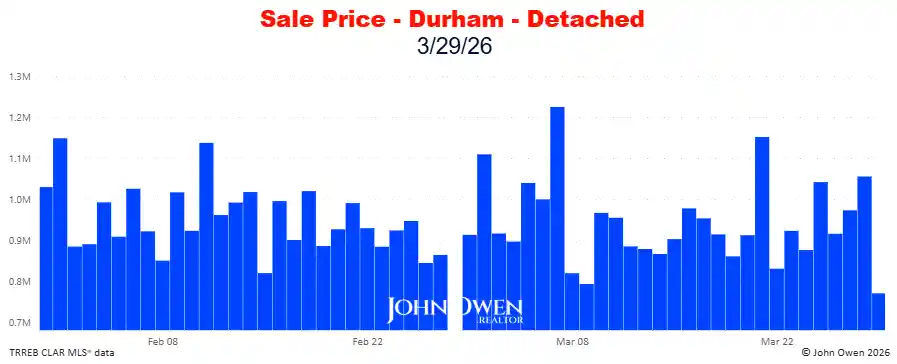
The following map reflects the average selling price of detached homes over the last 30 days, which is just above 940,000.

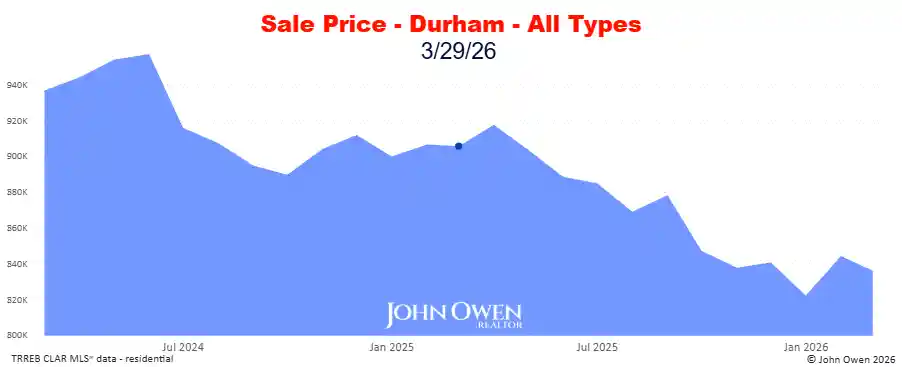
Most communities in Durham Region are showing sales at levels below list price. The following chart shows how this metric has been rising this year after dropping for most of 2025 across the region.
Some listings at low to mid-price points are posted with offer dates, and no offers will be considered until that date. This is intended to pressure buyers (when there is a perceived shortage of listings) and generate multiple offers.
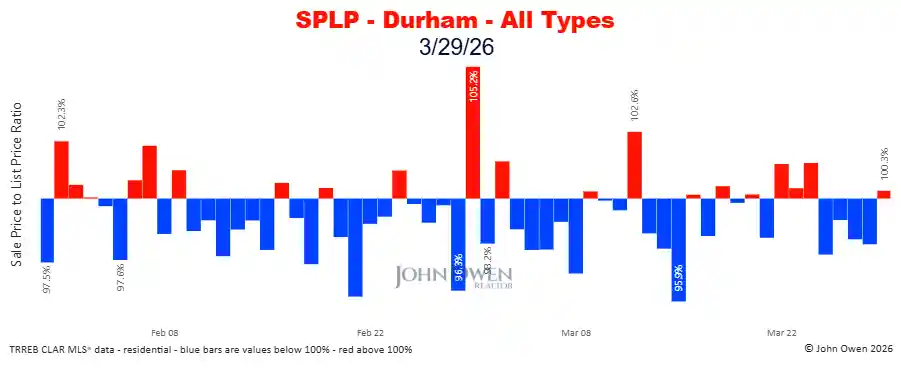
The selling price to list price ratio (SPLP) has averaged below the 100% mark, indicating that most homes sell under their list price. This suggests that most of the time, only one offer is placed on properties, indicating that multiple offer scenarios are not the norm in most transactions.
Note the blue bars in the chart, which indicate SPLP averages below 100%, versus the red bars, indicating averages above 100%. Those blue bars are dominant, indicating that buyer competition on listings has declined (except at lower price points, excluding condos).
Days on market (DOM) are averaging 24.3 this month. DOM is the number of days it takes for a property to be sold firm, or without any remaining conditions. This does not account for time on market when listings are removed and relisted.

This figure typically rises in the winter season and is lowest during the spring peak. It’s currently trending lower, indicating that buyer demand is picking up.
Should new listings rise faster than current sales, there would be more inventory for the pool of buyers to choose from, which lowers the sale price to list price ratio and months of inventory, which brings us closer to a balanced market.
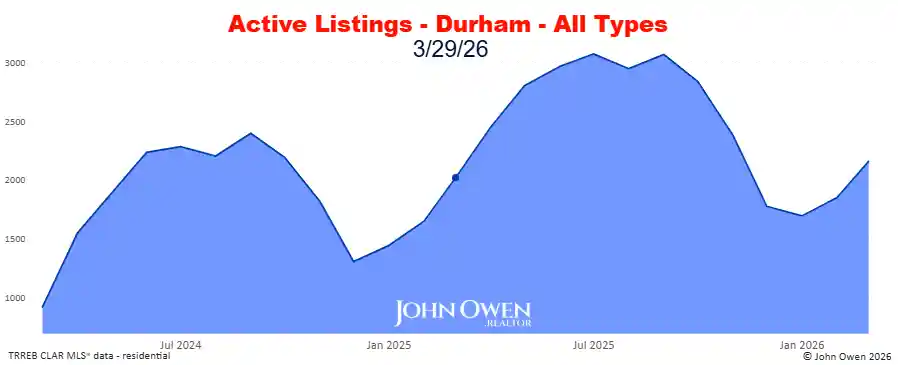
Listing inventory reached levels not seen since 2009 last summer (and has come down from that level since). There are still choices for buyers, with numerous options to select from. For sellers, it presents opportunities for those who are well prepared and priced properly. For others (with unrealistic expectations), it will introduce challenges.
The high number of active listings in some segments makes having a strong plan essential when selling a property. When listings are more scarce (lower price points, excluding condo apartments), prospective buyers must reduce expectations on location, property condition, etc. They will also be pressured in competitive situations to remove conditions on their offers.

The sales rate is up by 31.8% compared to last month and down 10.9% versus last March, with 19.9 daily transactions.
The following chart shows the daily sales volume for the past 2 months.


Buyers will find multiple offer situations in some locations, particularly at lower price points. They are highly advised to get prepared - have their mortgage preapproval ready before looking at homes, and be prepared to view homes via photos and virtual tours as soon as they reach the market. With interest rates dropping and mortgage rules changing, knowing your options is more important than ever. Speak with your agent to discuss the process to move forward.
Sellers should plan to put their homes on the market soon and work with their agents to set them apart from competing listings while reaching the widest possible audience. This is particularly important at mid to high price points.
If you are interested in seeing values for an area not shown or are interested in other figures, please comment below or contact me. As always, reach out anytime to discuss this further without obligation.
More Durham Region and Area Real Estate Articles
Ontario Property Tax Rates by Municipality 2025
Durham Region Market Report - February 2026
Property Tax Calculator for Durham Region
My other blogs contain market reports and information for the surrounding areas—see the menu for details.
About the Author

John Owen, Broker, REMAX Impact
John is an award-winning REMAX broker based in Courtice, ON, serving a wide area from east GTA to Northumberland.
Direct - 905-434-0067
Email - johnowen@remax.net
Member - REMAX Hall of Fame, Canadian Real Estate Association, Ontario Real Estate Association, Toronto Regional Real Estate Board.

Comments:
Post Your Comment: