

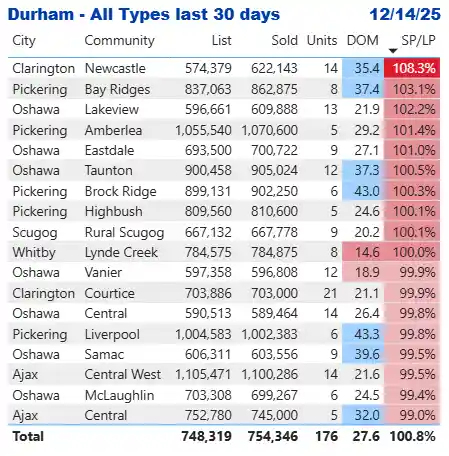
Here are the top 20 communities in Durham Region ranked by sale price over list price. Figures above 100% represent places that sell for more than list price, on average, sometimes called overbidding.
Durham Region Worst Performing Communities
For contrast, here is a table showing the bottom performing communities in Durham Region. Again, they are ranked by sale price compared to list price, with the lowest percentages appearing higher in the list.
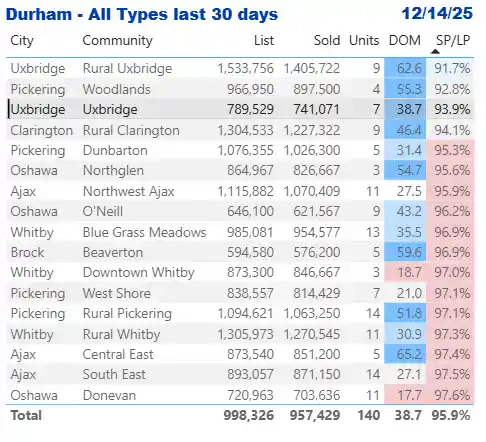
There are many ways to break down sales figures. We could also consider average days on market or average sale price, both of which are shown in the tables. Days on market is one variable that usually correlates to sale price to list price ratio.
Higher days on market typically have lower SP/LP ratios. Sale prices, however, normally don’t correlate as much.
More Durham Region and Area Real Estate Articles
Ontario Property Tax Rates by Municipality 2025
Durham Region Market Report - September 2025
Property Tax Calculator for Durham Region
My other blogs contain market reports and information for the surrounding areas—see the menu for details.
About the Author

John Owen, Broker, RE/MAX Impact
John is an award-winning RE/MAX broker based in Courtice, ON, serving a wide area from east GTA to Northumberland.
Direct - 905-434-0067
Email - johnowen@remax.net
Member - RE/MAX Hall of Fame, Canadian Real Estate Association, Ontario Real Estate Association, Toronto Regional Real Estate Board.

Comments:
Post Your Comment: