

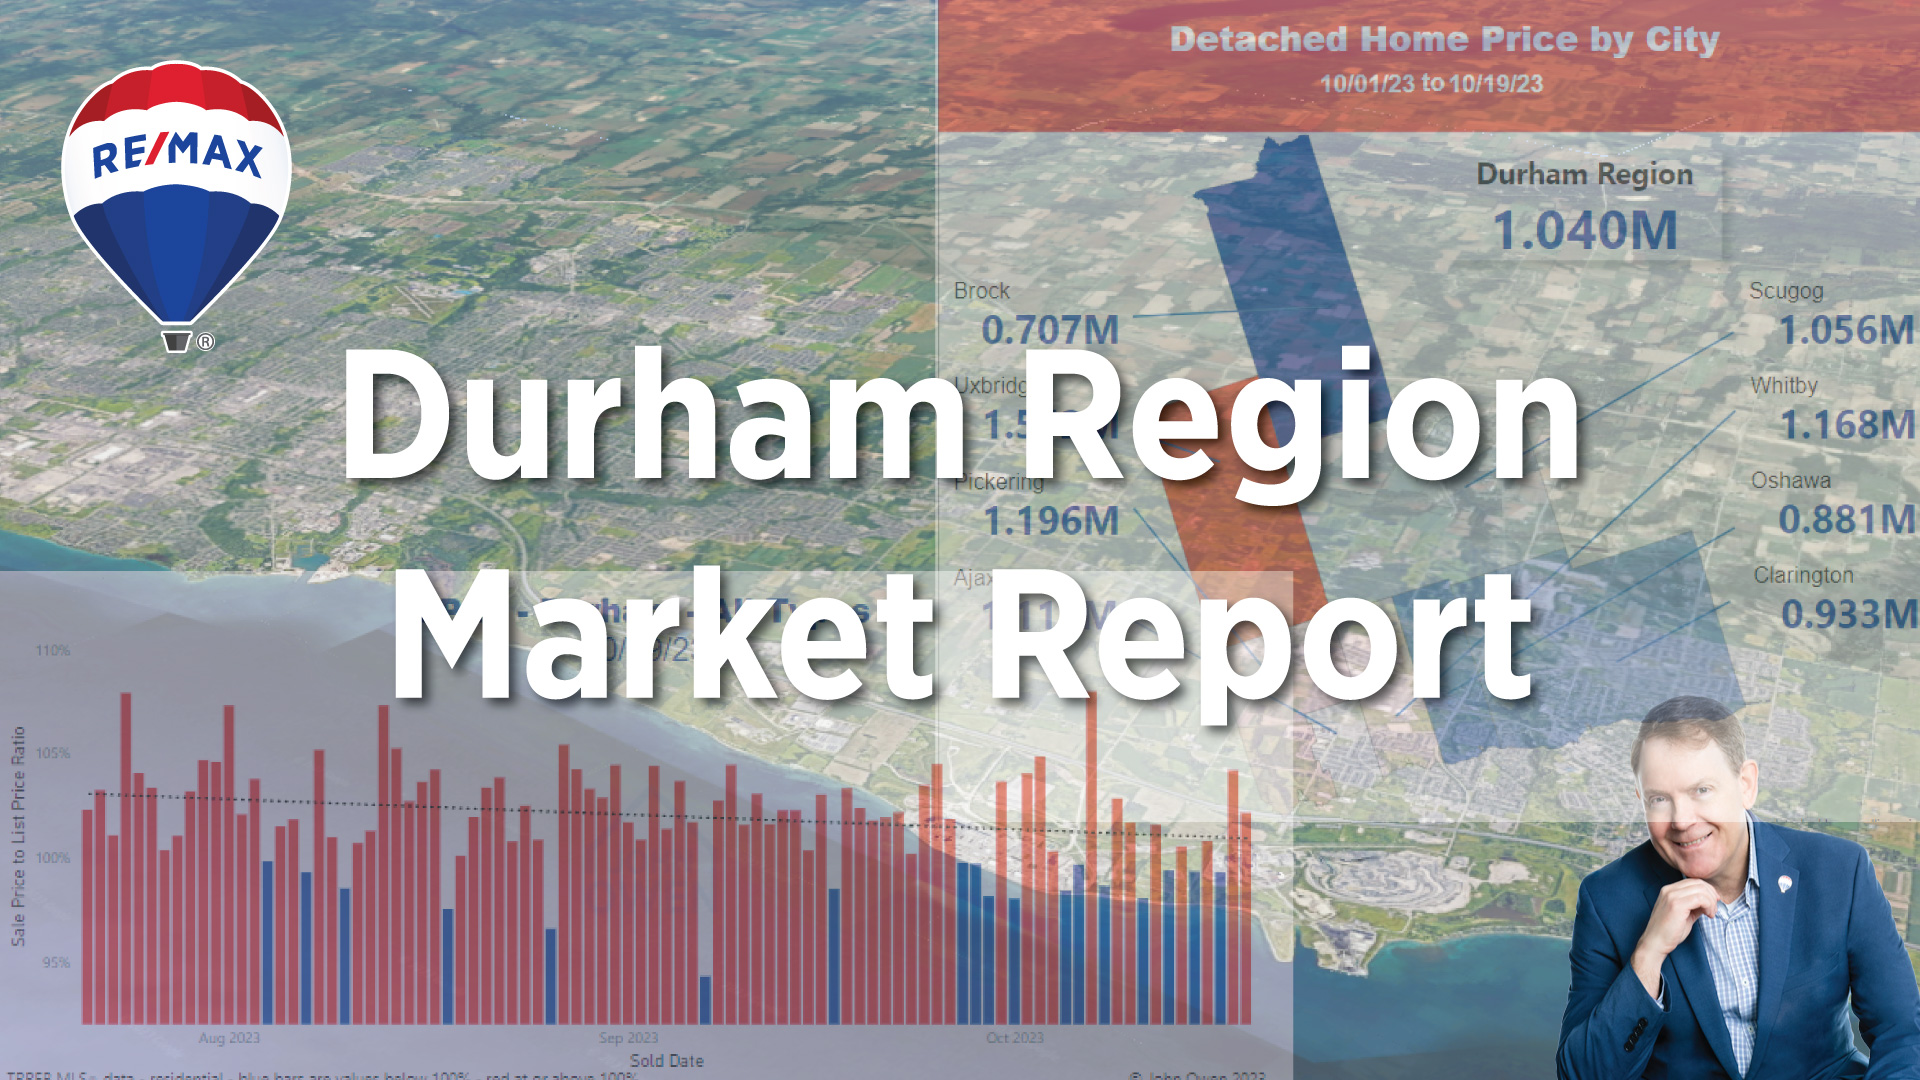
Durham Region Real Estate Monthly Market Update
Last updated March 5, 2024, at 11:45 a.m.
View the latest market report
The real estate market in Durham Region is through February 2024 with far more activity and optimism from a buyer pool that was largely dormant in 2023. Buyers waiting for a further dip in prices should expect to be disappointed as prices are heading higher.

Just listed!
22 Daniels Drive, Brighton
$1,399,990 MLS#X8111876
One Of The Most Luxurious Homes In Brighton! Spectacular Backyard Oasis With Heated Inground Pool & Waterfall, Brick Cabana With Change Room, 3 Pc Bath, Wet Bar, Hot Tub. Meticulously Maintained Park-Like Grounds On A Private, Double Pie Lot.
More details: https://johnowen.realtor/mylistings.html/listing.22-daniels-drive-brighton.99516150
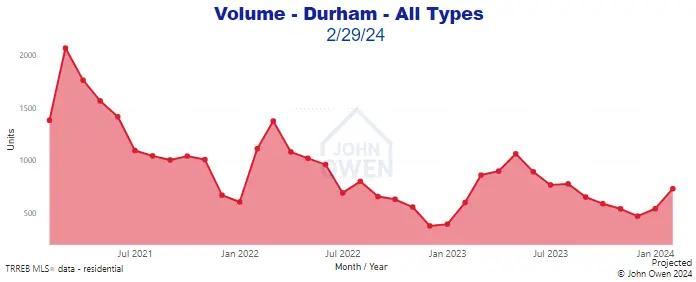
Sales volume is well above the December low for the season. Listing inventory is climbing, though still very low in south Durham relative to sales volume.
Multiple offer situations are now the norm in lower and middle price ranges, as buyers scramble to compete for homes within their budgets. Read on for more details on how average selling prices are close to the 102% mark now. Tightening inventory and improved buyer confidence looks to be driving the change.
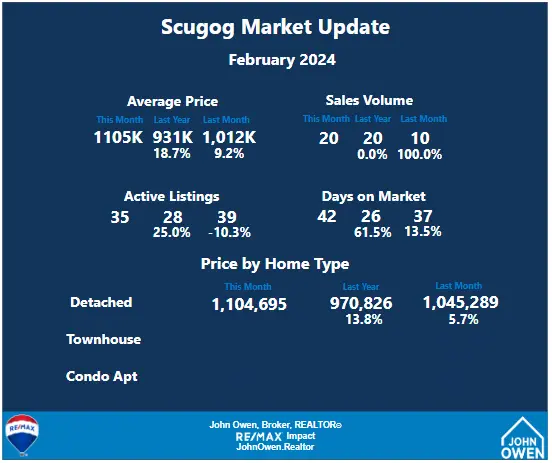
As buyer competition heats up, watch for things to pick up in the higher price ranges and outlying communities. We are already seeing an abnormally strong demand in Scugog. I expect this to extend to Northumberland and Peterborough districts as well.
Should mortgage rates ease further, expect this situation to intensify. Current projections amongst industry experts put the timeline for rate drops at the Bank of Canada in the late spring or early summer.
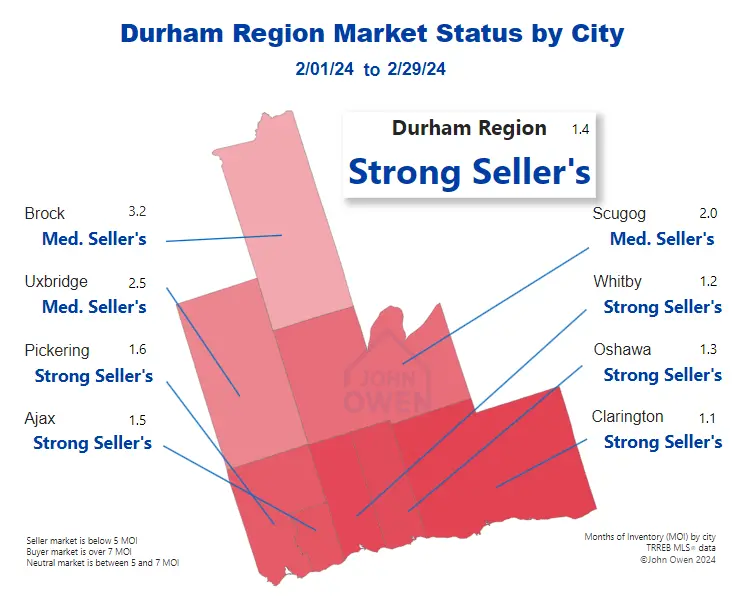
Supply is extremely low to moderate, with just 1.4 months of inventory (MOI) for the entire region, and higher levels in north Durham communities. (This means that at the current pace of sales, with no new listings, all inventory would be sold within this time frame).
Durham Region Real Estate Market February 2024
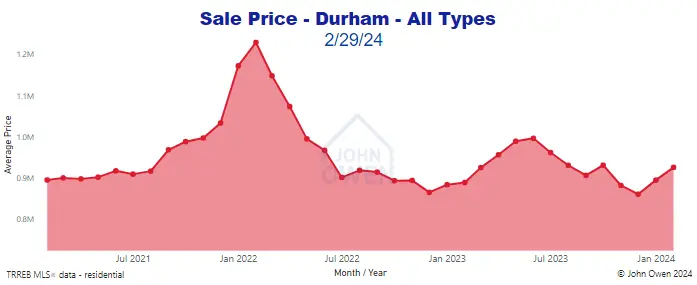
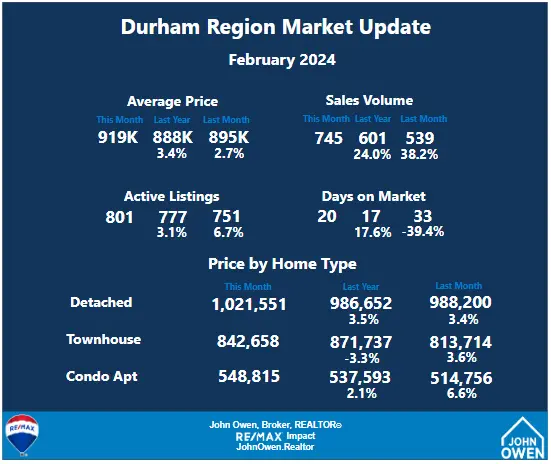
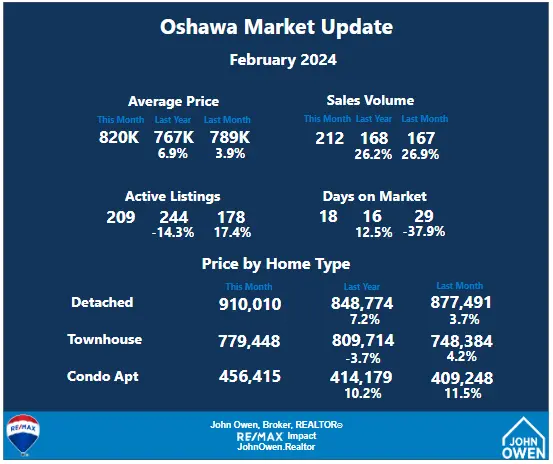
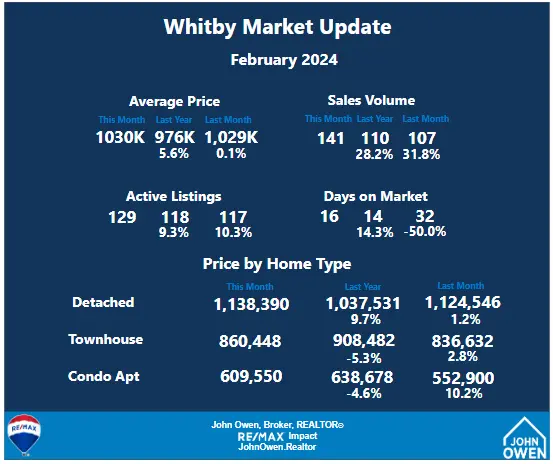
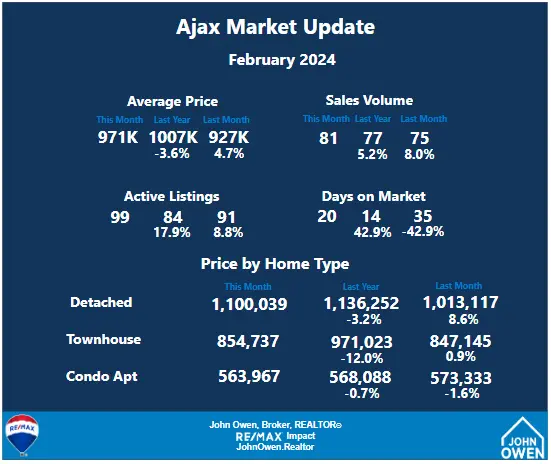
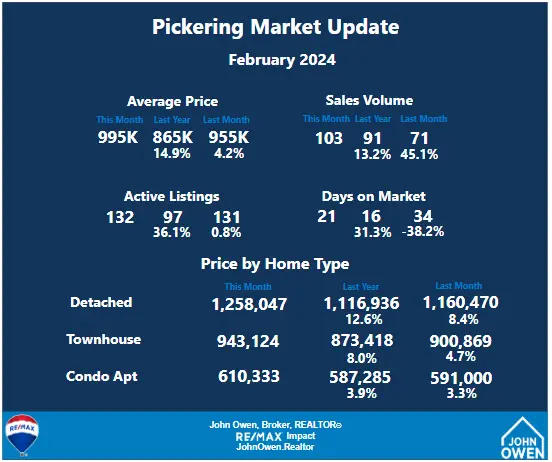
In February, transactions reported thus far had selling prices averaging 926,202 in Durham Region, with the average property selling at 102.6% of list price (SP/LP). This is a 3.5% increase from last month and a 4.2% increase from last year.
Here is a look at average detached home selling prices each day over the past 3 months: Prices are trending higher following the low in December.
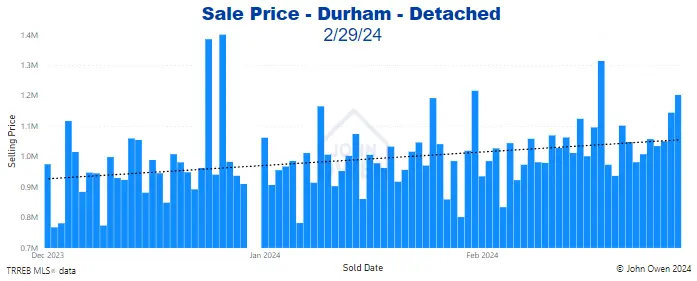
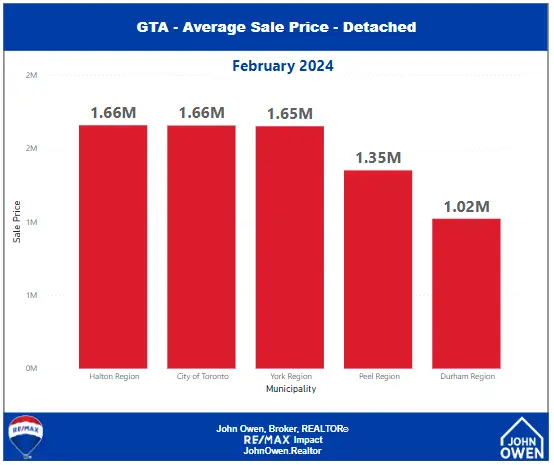
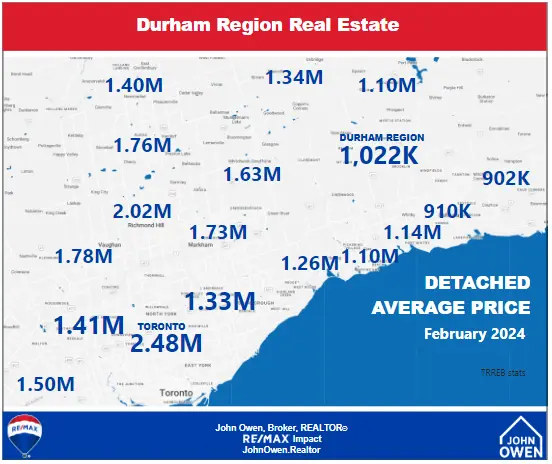
The average selling price of detached homes is just below 1,030,000, as summarized in the following map.
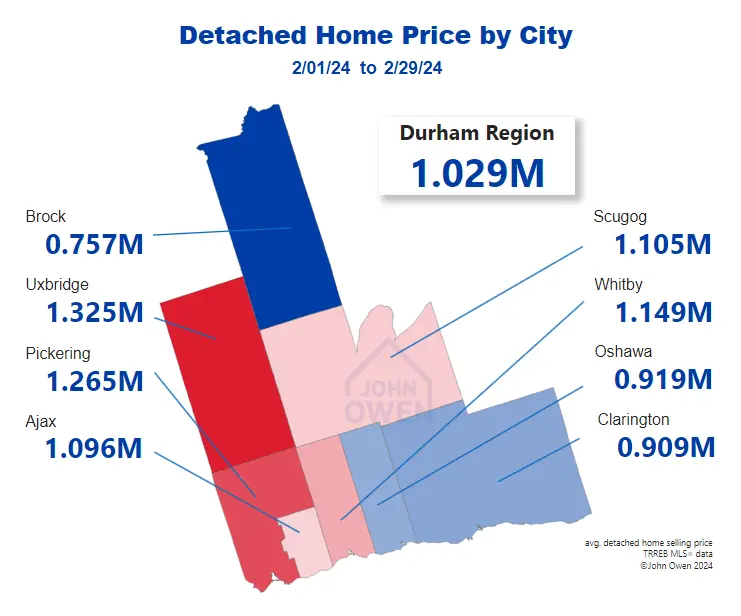
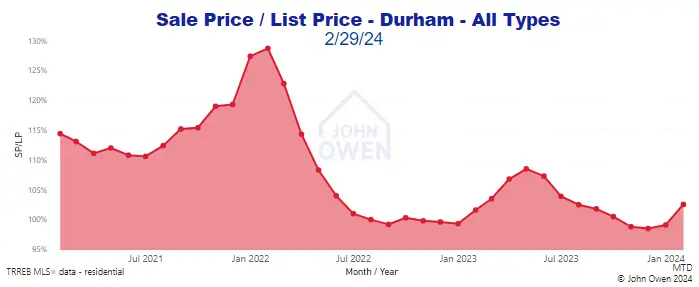
If you look at the top chart's selling price to list price ratios, most communities in south Durham show sales at levels near list price. The following chart shows how market tightness slowed over most of 2022 and picked up in early 2023, before dropping. It is now on an upward swing again.
Many listings at low to 1 million plus price points are posted with offer dates, where no offers will be considered until that date. This is intended to pressure buyers (given the shortage of listings) and generate multiple offers.
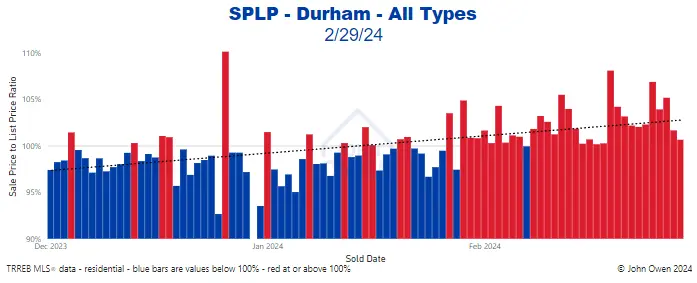
Also, SPLP (selling price to list price ratio) has averaged near the 102% mark, indicating that most homes sell above their list price. In those cases, more than one offer is being placed on properties, signalling that bidding situations are still in the mix - just not with the same frequency as before the recent downturn.
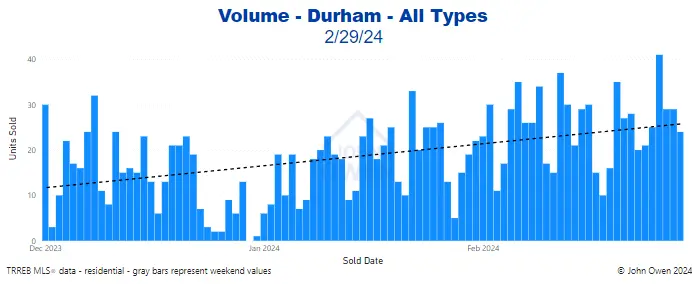
Note the dominance of blue bars in the chart before mid-January, demonstrating SPLP averages below 100%, then an increase in red bars, indicating averages above 100%. Those red bars are starting to show much more frequently again, so watch as the next little while unfolds, especially if inventory remains low.
Days on market (DOM) averaged 19.6 days. DOM is the number of days it takes for a property to be sold firm, or without any remaining conditions. This figure has been dropping recently - another sign of a market gaining steam.

This figure had dropped substantially last spring and had been higher over the summer. It is now more stable but is heading lower.
Should new listings rise at a pace that is faster than current sales, then there would be more inventory for the pool of buyers to choose from, which will have the effect of reducing the sale price to list price ratio, then months of inventory stat, which leans the market closer to a balanced market.
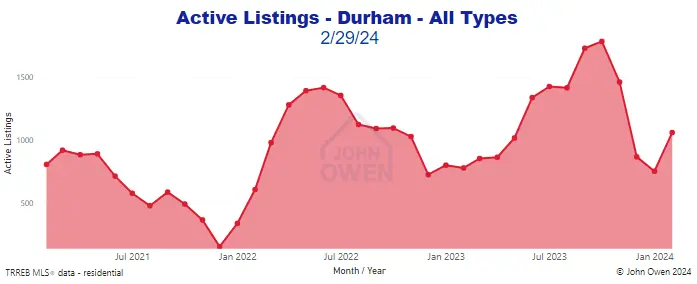
Active listings had dropped in the winter months last year. They climbed since last December to the highest levels since 2020 in October, though sales have been strong enough to keep inventory levels low compared to the pace of sales.
The level of listings also makes taking steps to compete among selling properties more essential. When listings were more scarce, (including now but at lower price points) prospective buyers were compelled to reduce expectations on location, property condition, etc. They also will have pressure in competitive situations to remove conditions on their offers.
The rate of sales has increased by 36.7% compared to last month and is up 23.2% compared to last year, with 25.4 transactions per day.
The following chart shows the daily sales volume for the past 3 months.

Buyers will still find multiple offer situations in many locations and price ranges, particularly at lower price points. They are highly advised to get prepared - have their mortgage preapproval ready before looking at homes, and be prepared to view homes via photos and virtual tours as soon as they reach the market. With interest rates being volatile, and mortgage qualification rules under review, locking in a rate is more important than ever. Speak with your agent to discuss the process to move forward.
Sellers should be planning to put their homes on the market soon and working with their agent to set their home apart from competitive listings while reaching the widest possible audience.
If you are interested in seeing values for an area not shown or are interested in other figures, please comment below or contact me. As always, give me a call anytime if you would like to discuss this further without any obligation.
More Durham Region and Area Real Estate Articles
Northumberland Real Estate Market Report
Peterborough Real Estate Market Report
Durham Region Property Tax Rates - GTA and Ontario
Durham Region Market Report - January 2024
About the Author

John Owen, Broker, RE/MAX Impact
John is an award-winning broker with RE/MAX Impact Realty in Courtice, ON, and was their number one agent in GCI for 2022.
Direct - 905-434-0067
Email - johnowen@remax.net
Member, Canadian Real Estate Association (CREA), Ontario Real Estate Association (OREA), Toronto Regional Real Estate Board (TRREB).
The figures shown are for the following property types unless otherwise specified: detached, semi-detached, condo townhouse, condo apartment, link, att/row/townhouse, co-op apartment, detached condo and co-ownership apartment.


Comments:
Post Your Comment: