

Oshawa Community Performance
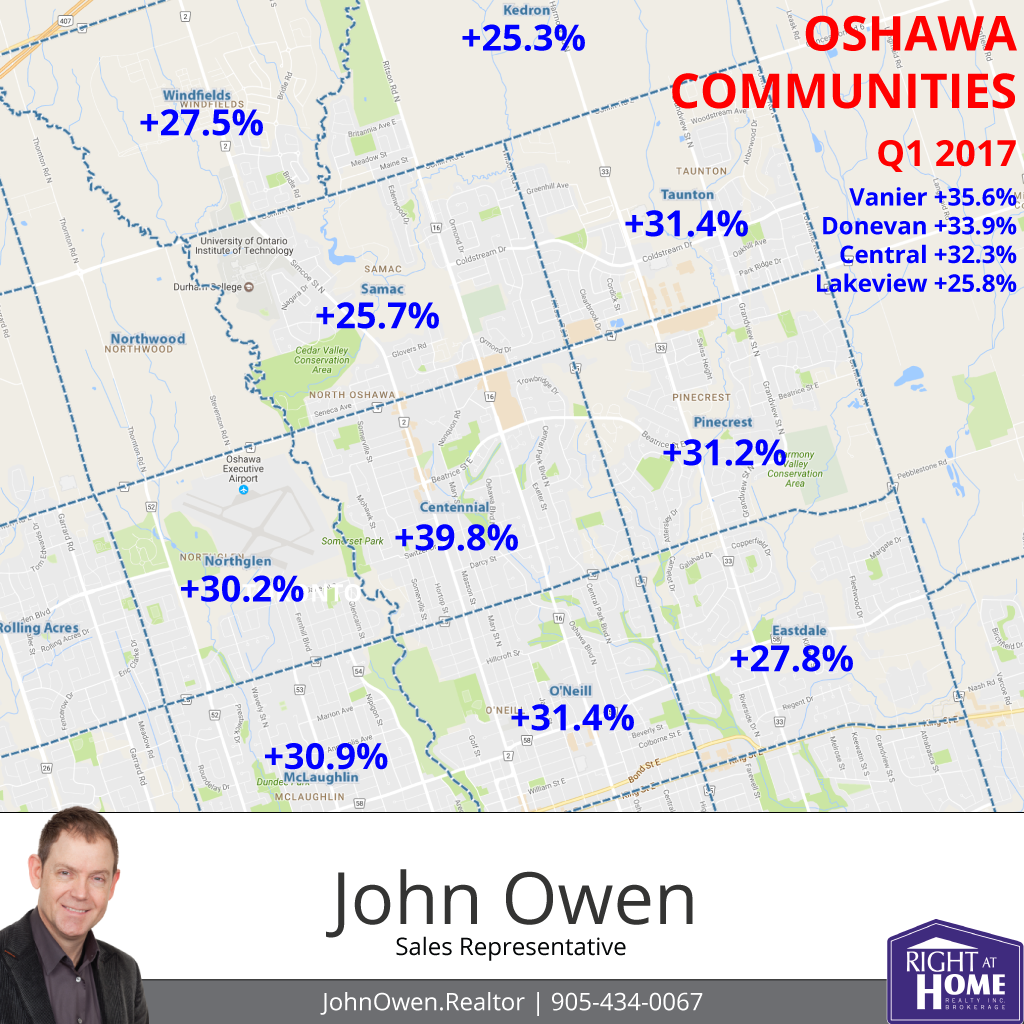
For the most recent quarter for which residential sales statistics are available, the following areas (or districts) showed the strongest year-over-year average price gain for the Oshawa area:
Centennial +39.8%
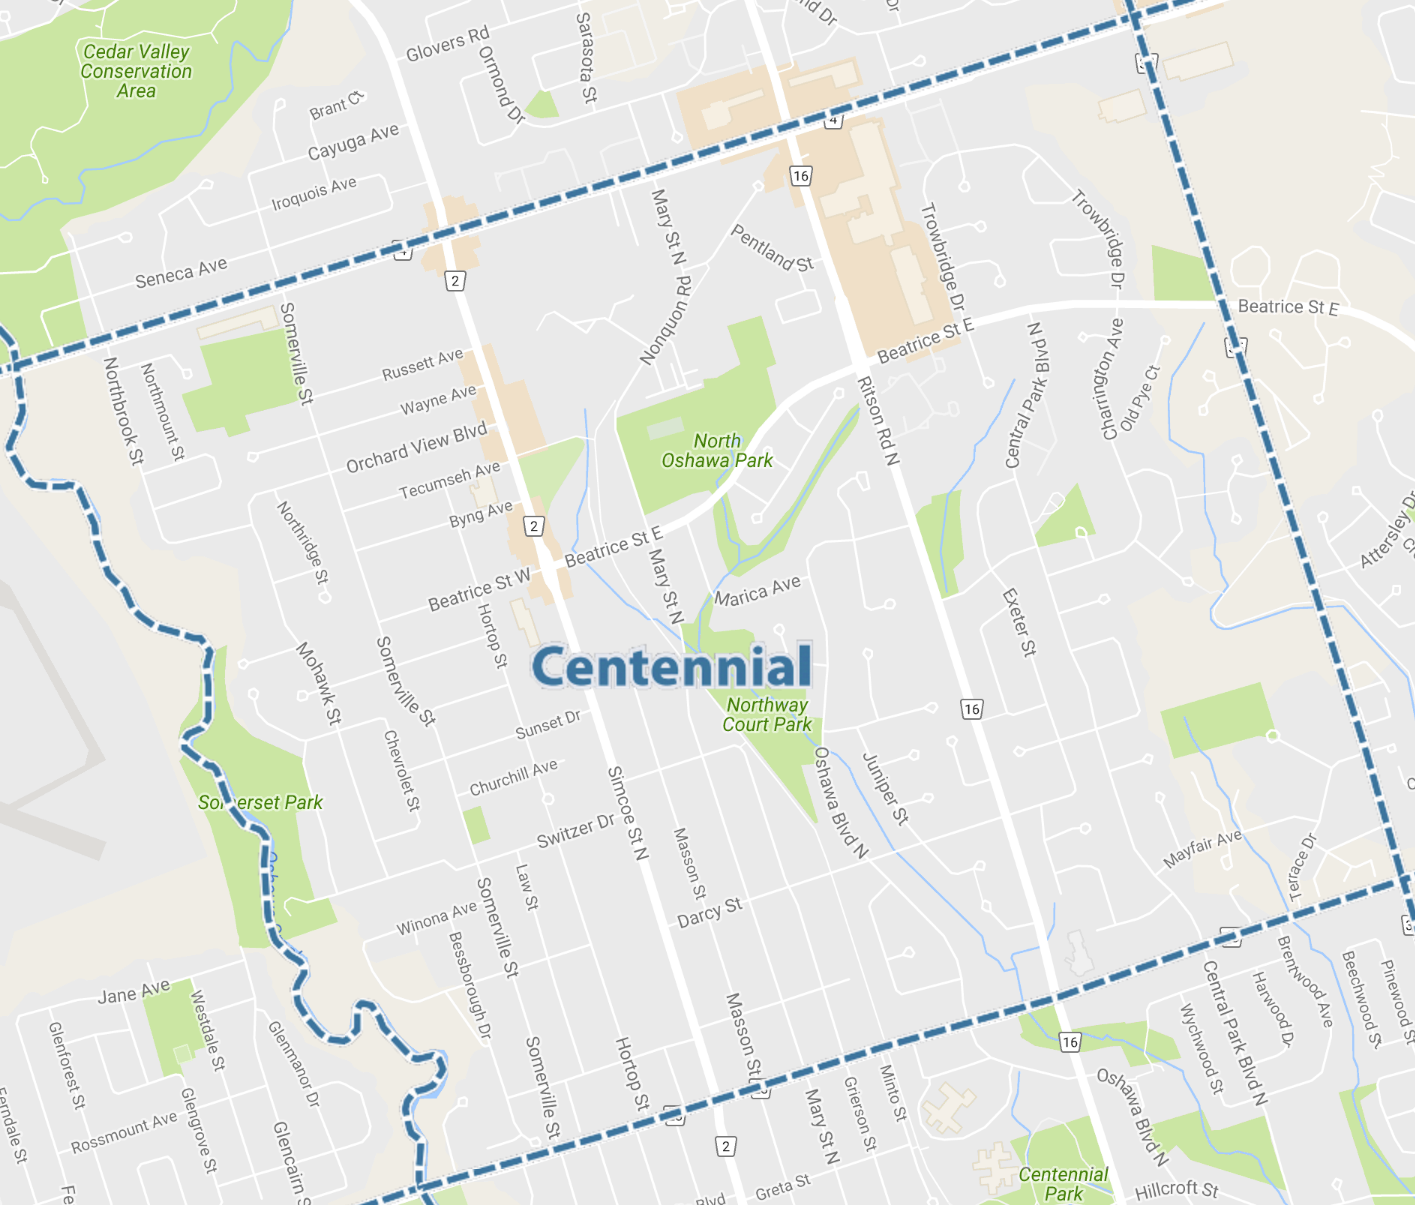
The number one area in Oshawa was Centennial. The average increase here was an outstanding 39.8% with the average price in Q1 of 2017 being $562,666. In Q1 of 2016, the average price was $338,521.
Vanier +35.6%
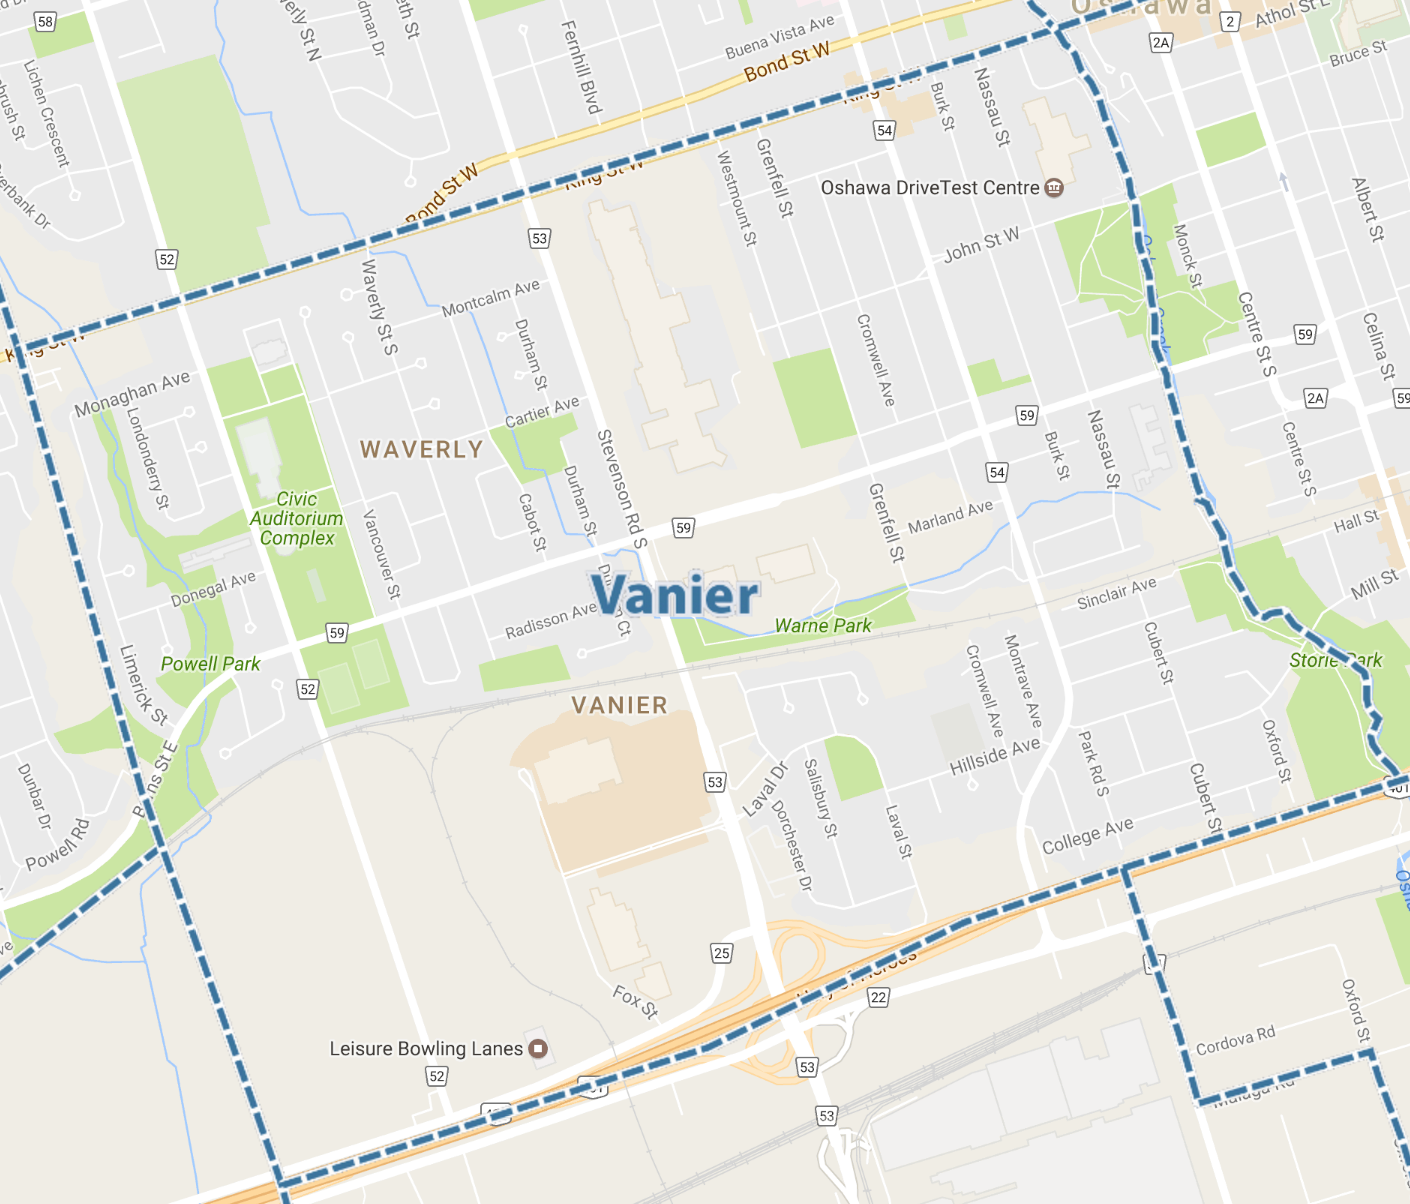
In second spot was Vanier. With an average gain of 35.6%, the average price was $424,417 in Q1 2017 over an average of $273,359 last year.
Donevan +33.9%
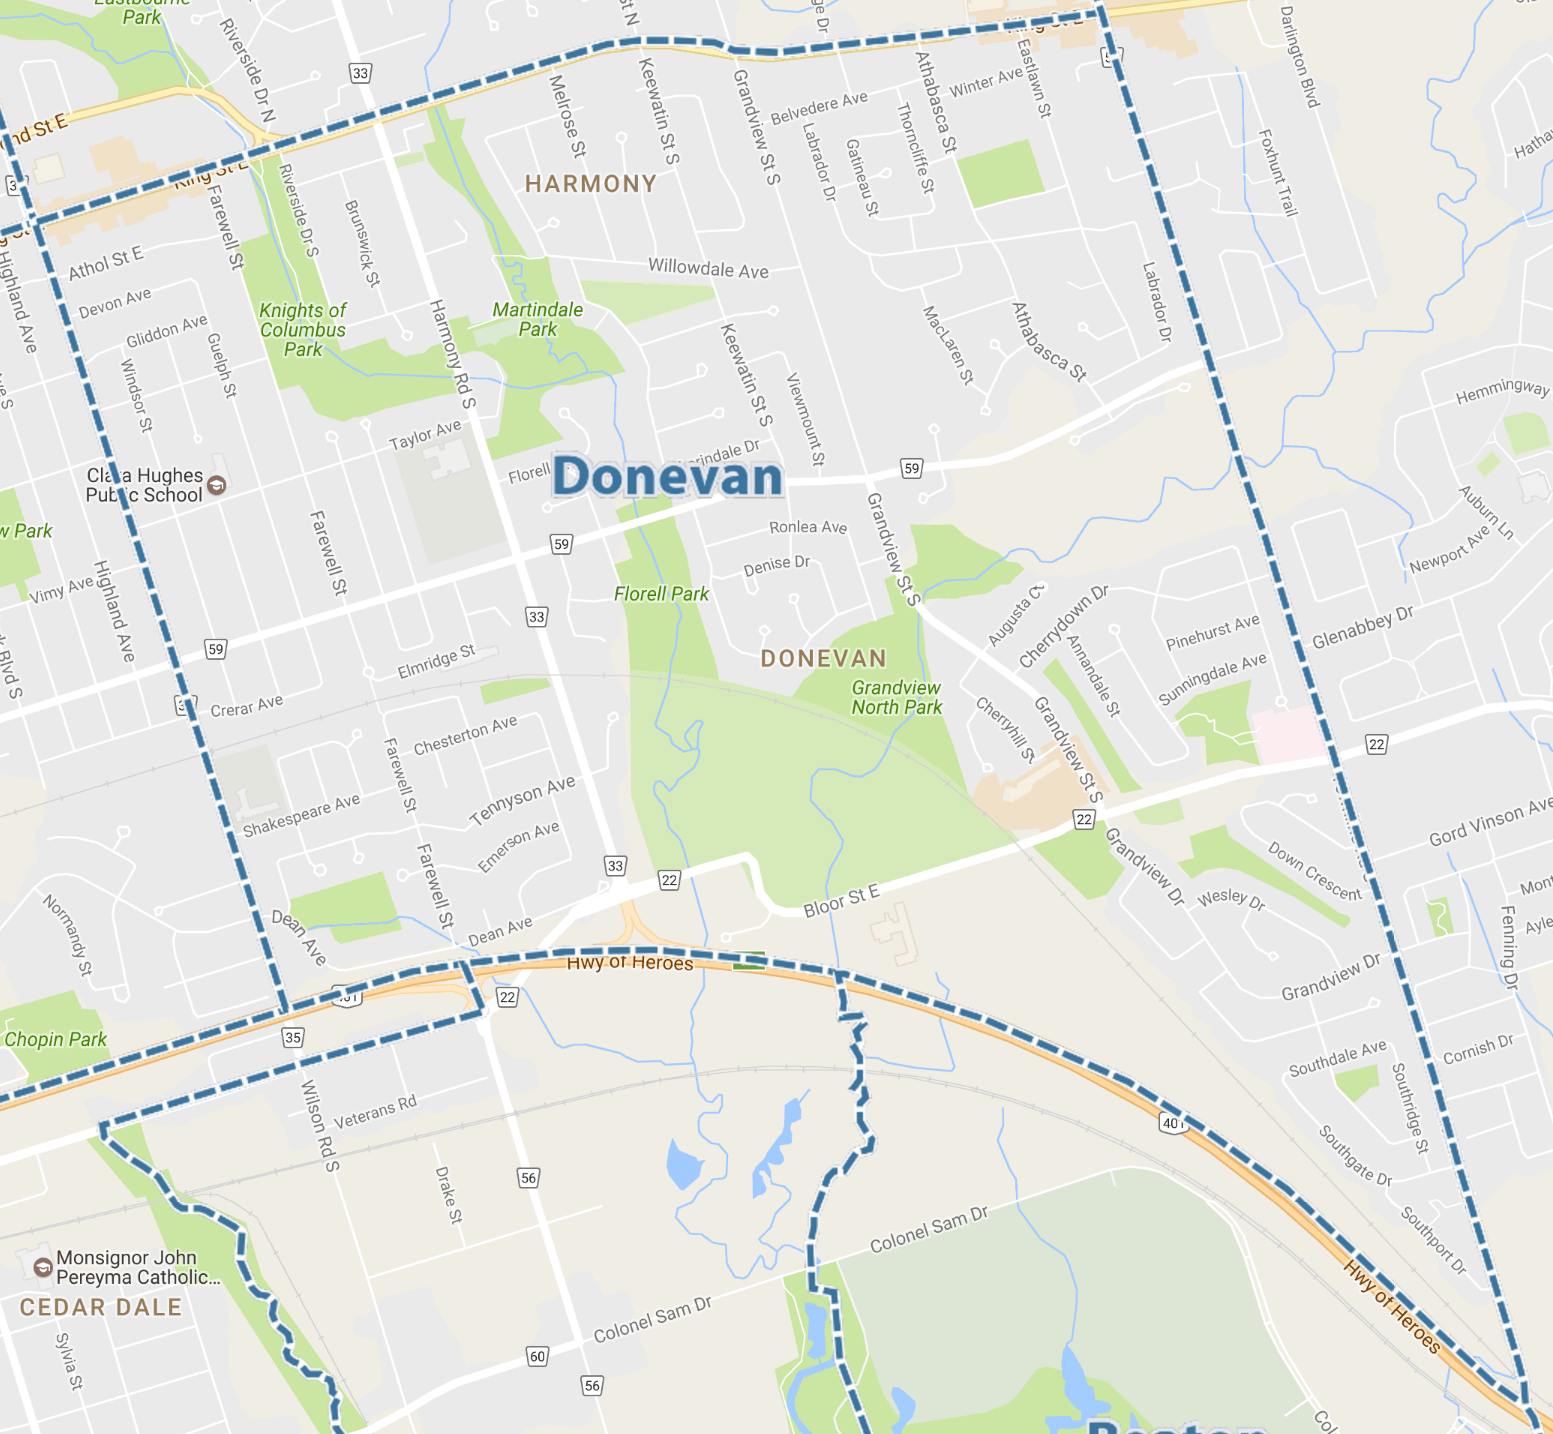
Third place went to Donevan. Prices here rose 33.9% with an average selling price of $546,904 in Q1 2017 versus $361,693 in Q1 2016.
Central +32.3%
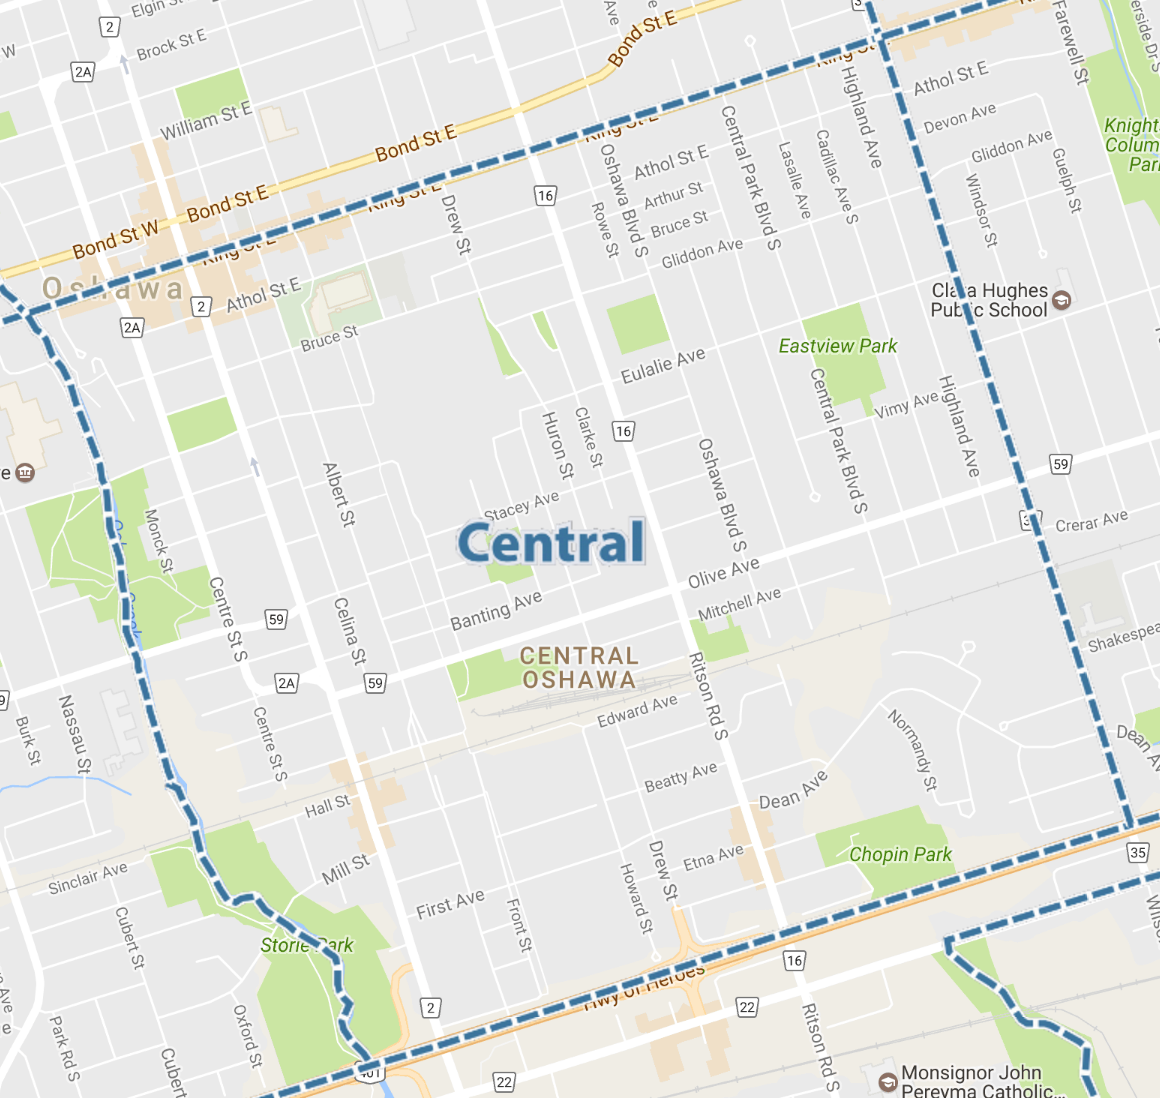 In fourth place was Central at +32.3%. In Q1 2017 the average price was $414,195, compared to $280,513 in 2016.
O'Neill +31.4%
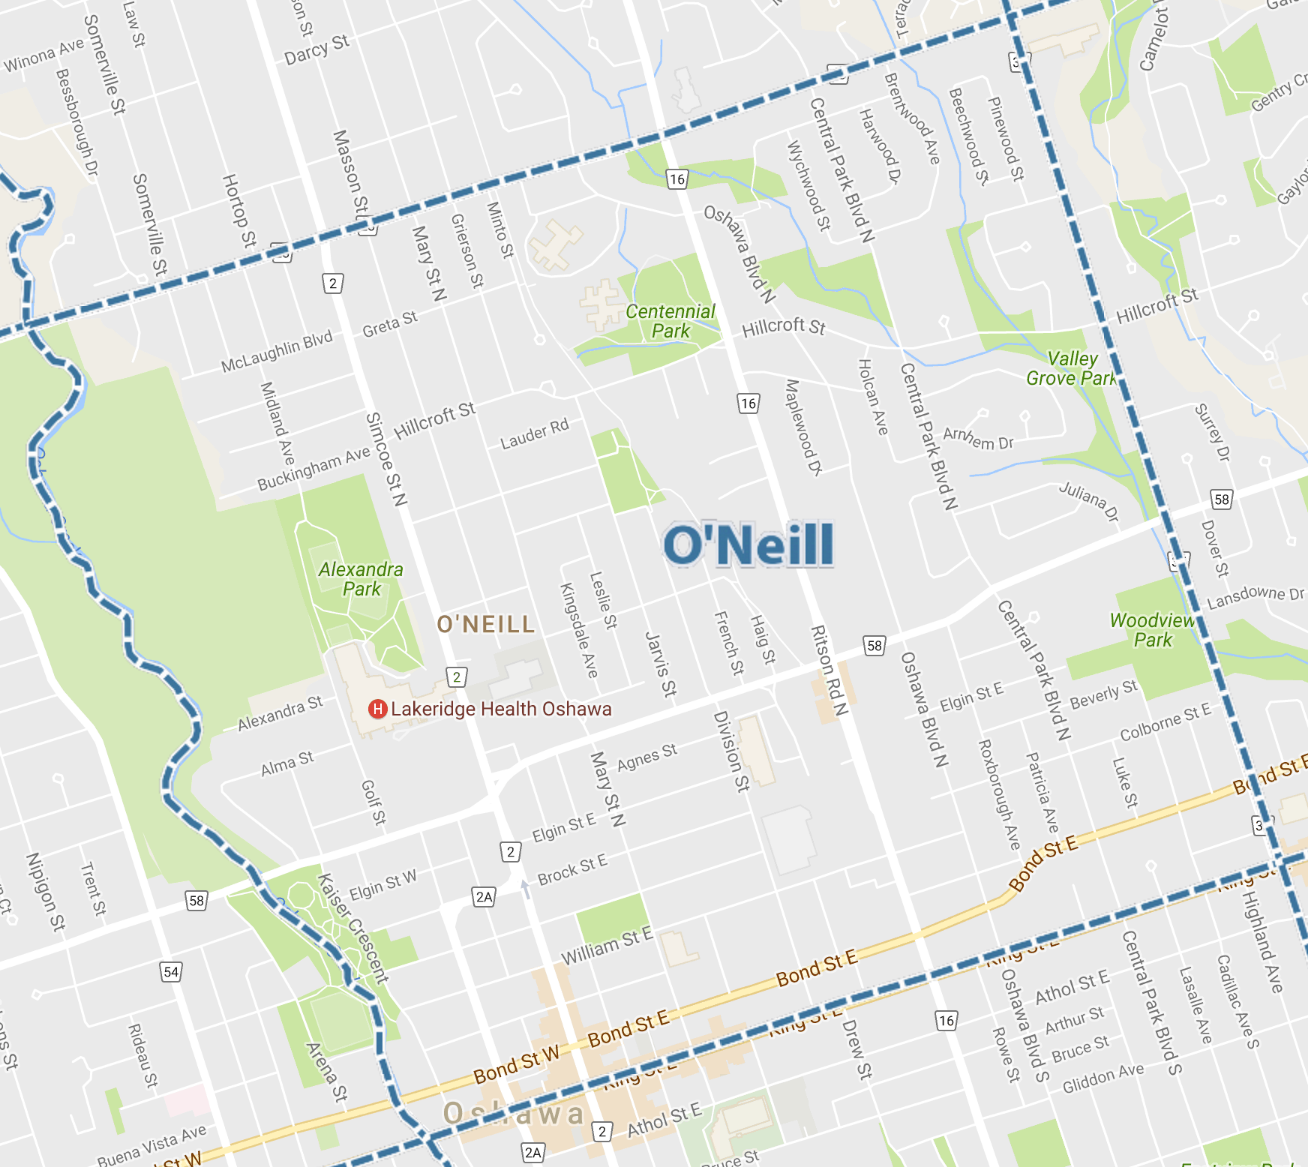 In fifth was O'Neill at +31.4%.
In Q1 2017, the average here was $456,728, versus $313,375 in 2016.
The rest?
Some neighbourhoods performed well under these, as listed below
Taunton +31.4%
Pinecrest +31.2%
McLaughlin +30.9%
Northglen +30.6%
Eastdale +27.8%
Windfields +27.5%
Lakeview +25.8%
Samac +25.7%
Kedron +25.3%
Looking Ahead
If you are interested in knowing how well your home has fared, please contact me for a complimentary market assessment.
Sales statistics are provided quarterly for neighbourhoods by the Toronto Real Estate Board, which hosts MLS sales data for Durham Region. The information provided here is for residential properties, in the first quarter (Jan through Mar) of 2017 as compared to the same period of 2016. Areas not reflected above did not have enough volume in one of the sales periods to provide a proper statistical comparison.
Additional reports:
Oshawa Top Areas

Comments:
Post Your Comment: