

Last update August 3 2023, at 11:10 am
July has come and gone, and the real estate market in Durham Region showed a seasonal drop in sales volume, an increase in inventory and a dip in sales prices. The pace of sales weren’t strong enough to keep pace with new listings, allowing prices to drop off in all areas of Durham, though selling prices remained above list prices across the region.
Prices eased lower in July. With interest rates rising again, buyer budgets took another hit.
Both fixed and variable rate mortgage rates are back on the rise recently, making getting that pre-approval (and rate lock) very important for buyers who haven’t purchased yet.
Multiple offer situations are still commonplace in low to mid price points, but with much lower intensity than in the spring.
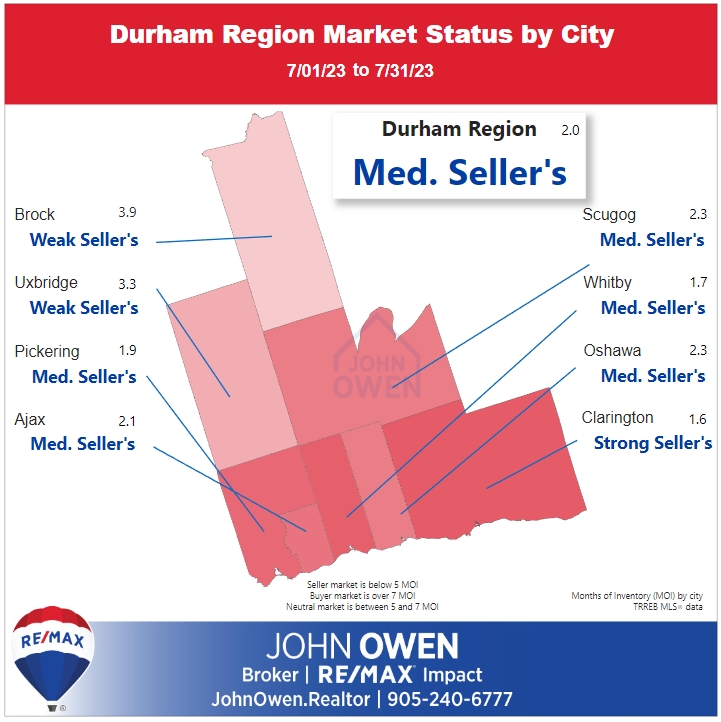
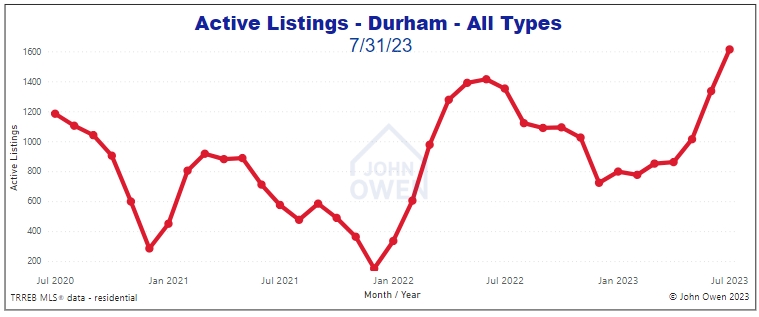
Supply is low to moderate, with 1.4 months of inventory (MOI - trend figure per TRREB) for the entire region, with higher levels in some north Durham communities. (This means that at the current pace of sales, with no new listings, all inventory would be sold within this time frame). The chart below shows a more current figure (non-trend), showing rising levels of inventory.
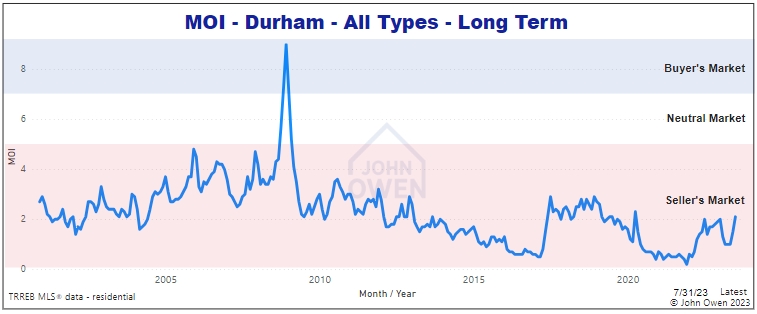
We haven't seen a true buyer's market across Durham Region since 2008, as shown in the chart below. In December of that year, months of inventory spiked to 9.
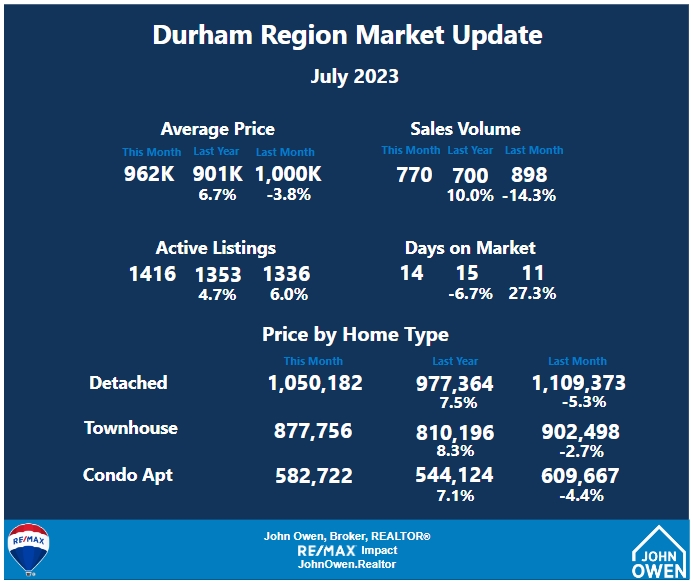
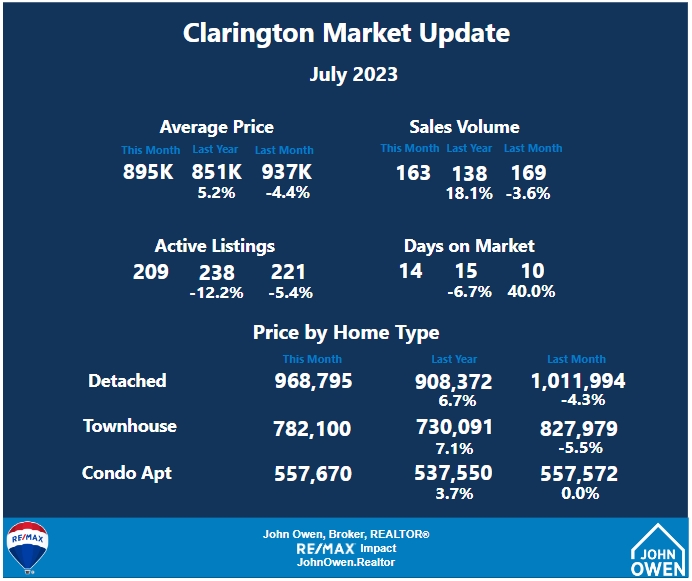
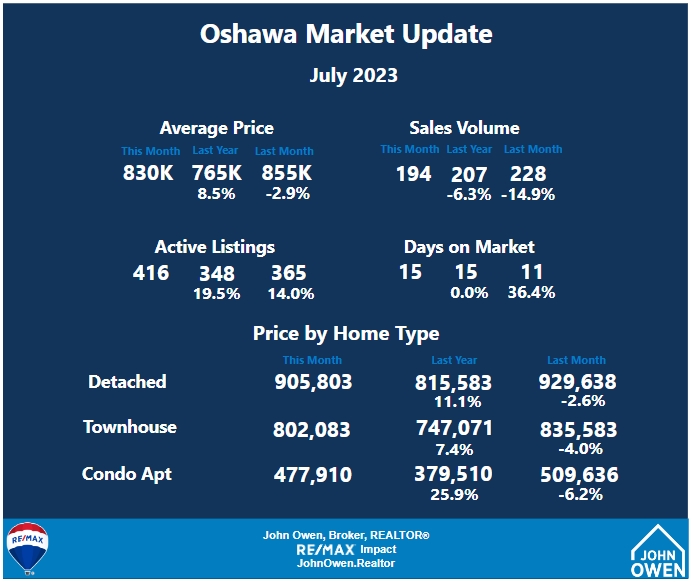
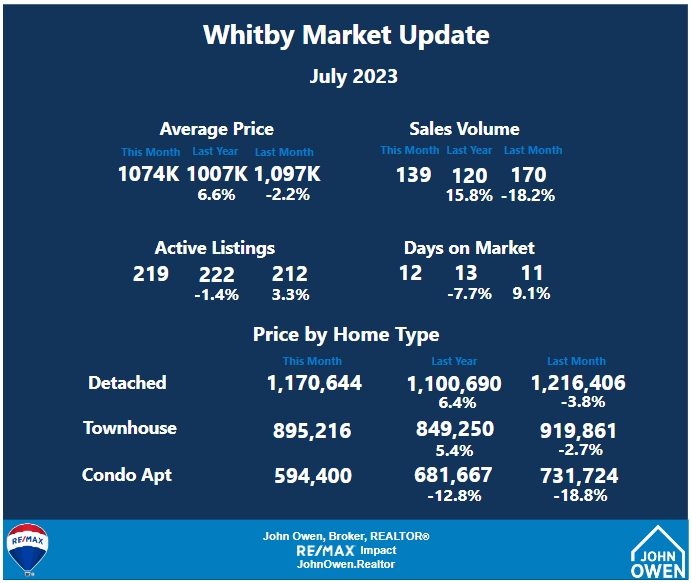
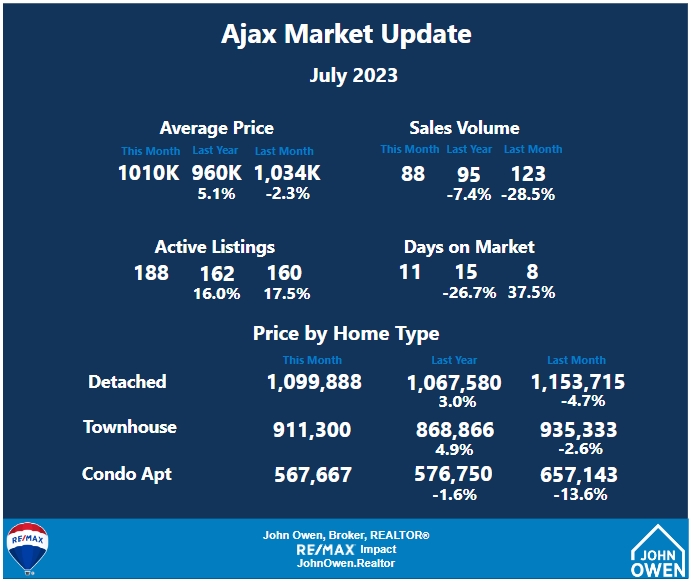
In July, transactions reported thus far had selling prices averaging 961,852 in Durham Region. This is a 3.8% decrease from June and a 6.7% increase from the same period last year.
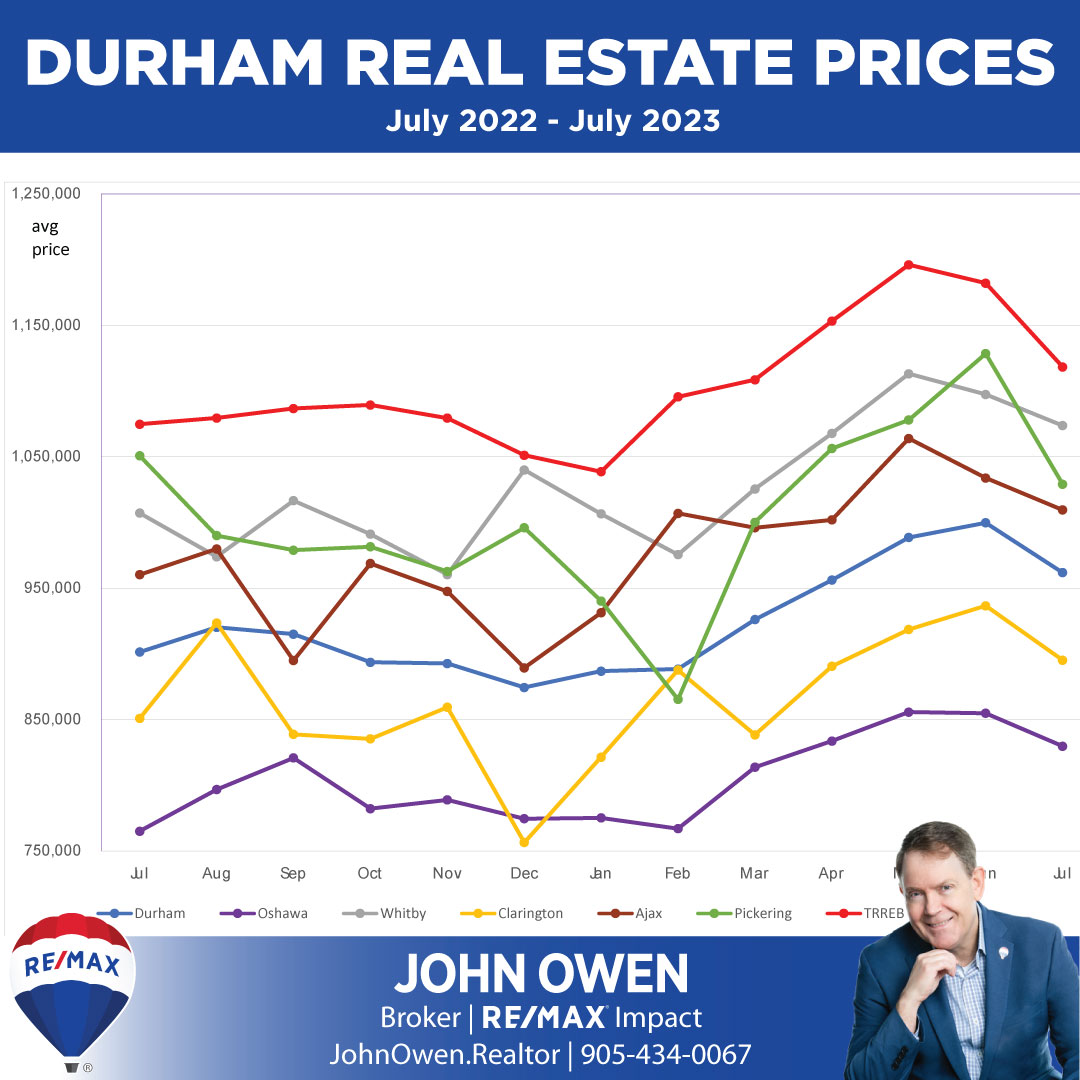
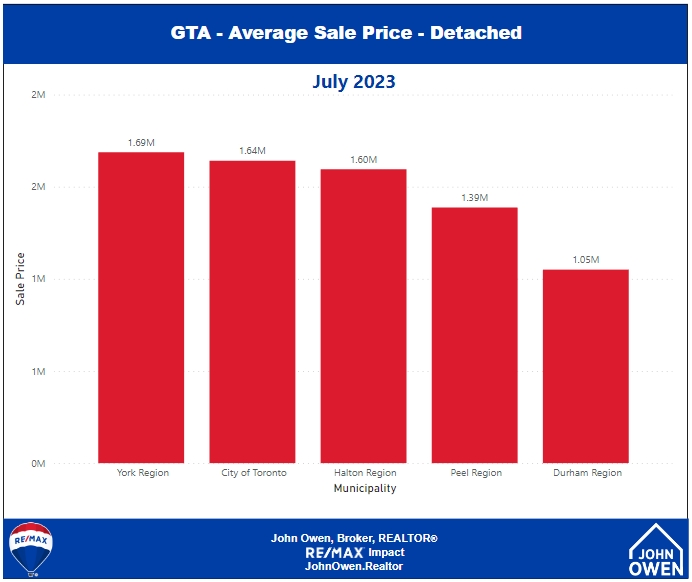
Prices in Durham continue to be among the most attractive for buyers in the GTA, as shown in the chart below.
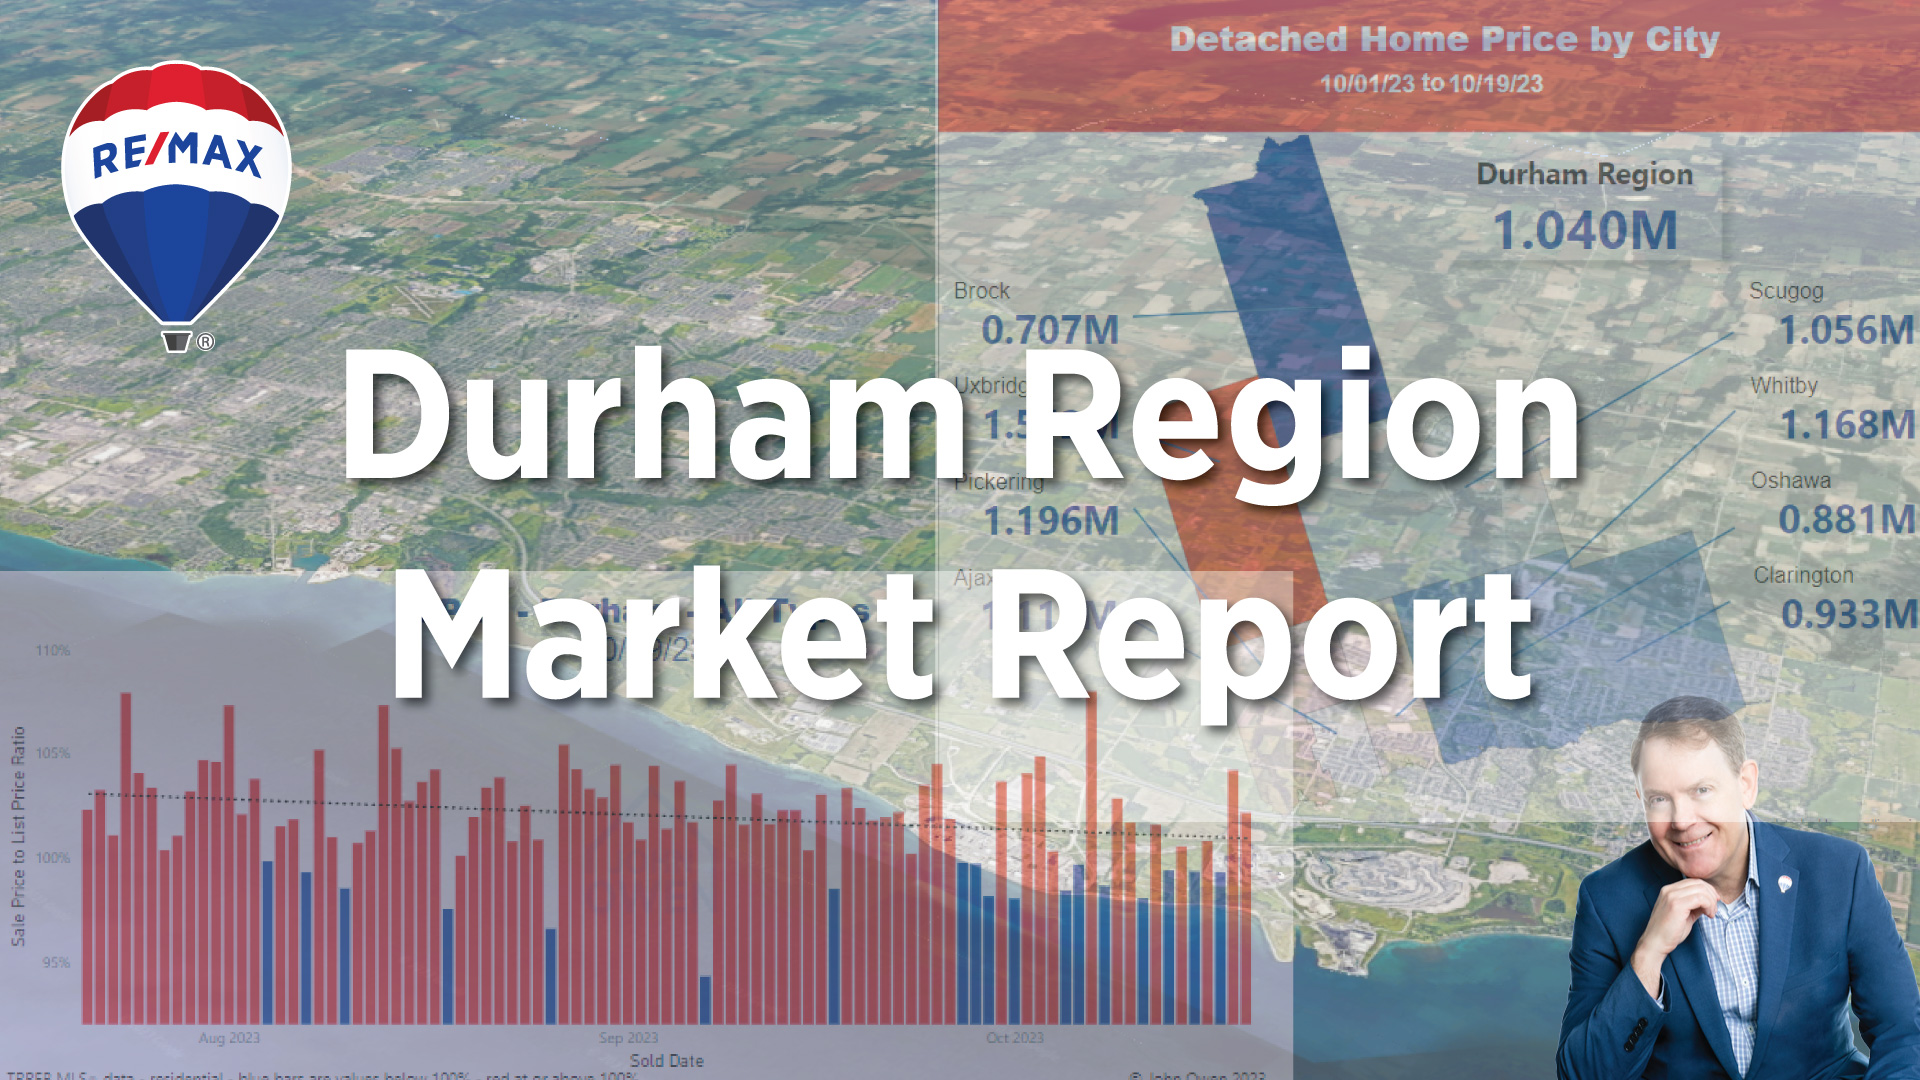
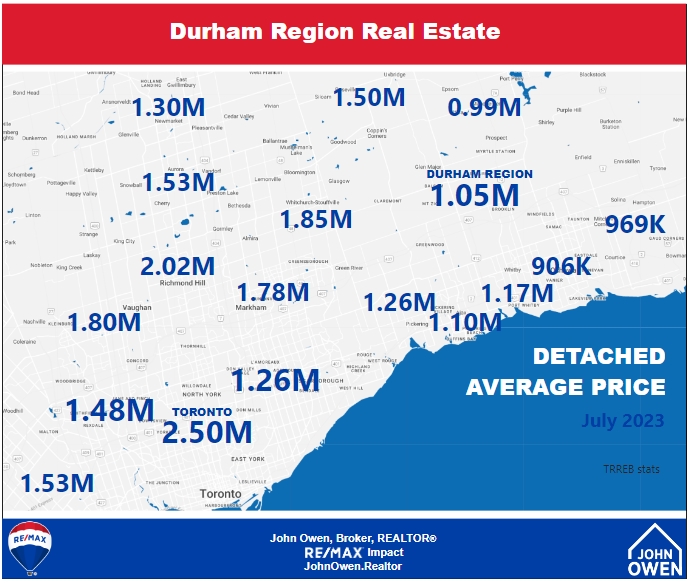
The average selling price of detached homes in Durham Region was just over 1,050,000 overall, as summarized in the following map.
Here is how prices fared for detached homes across the GTA:
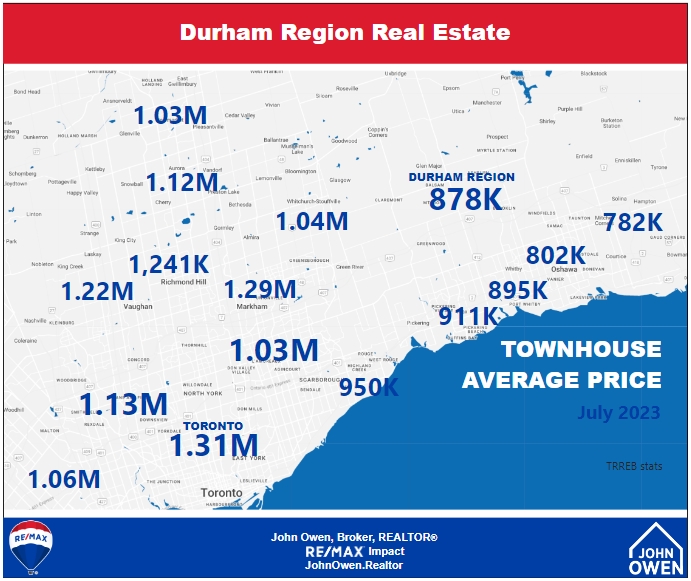
Townhouse sale prices are now averaging just over 875,000 across the region.
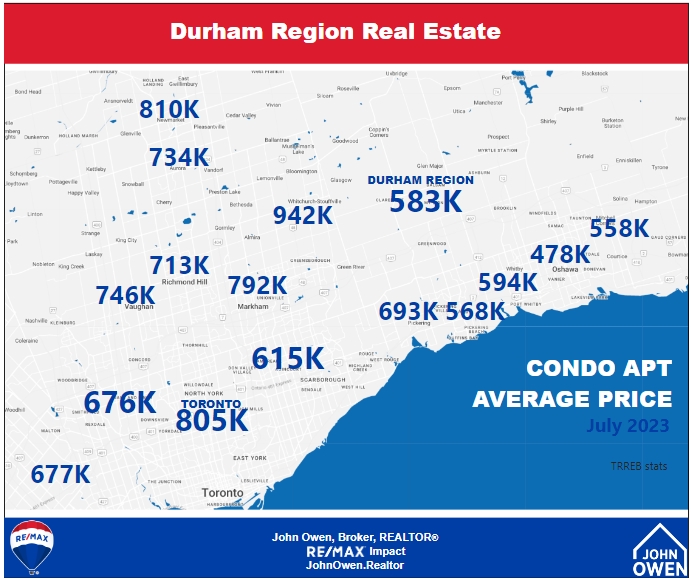
Condo prices across the GTA were as follows:
Most communities in Durham show sales at levels above list price. The following chart shows the trend - another key indicator of why the market had picked up in the early stages of 2023, and now are easing back somewhat.

In recent weeks, many listings in low to mid price points are being posted with offer dates, where no offers will be considered until that date. This is intended to put pressure on buyers (given the relative shortage of listings) and generate multiple offers.
Recently, SPLP has still averaged above the 100% mark, indicating that most homes are selling above their list price. This shows that a common scenario is for there to be more than one offer on properties, signalling that bidding situations are working back into the mix - just not with the same intensity as the peak early last year.
Days on market (DOM) averaged 14 days. DOM is the number of days it takes for a property to be sold firm, or without any remaining conditions.

This figure has dropped substantially since the beginning of spring.
Should new listings rise at a pace that is faster than current sales, then there would be more inventory for the pool of buyers to choose from, which will have the effect of reducing the sale price to list price ratio, then months of inventory stat, which leans the market closer to a balanced market.
Active listings had dropped in the winter months. They have risen since, though sales have been strong enough to keep inventory levels low compared to the pace of sales.
It also makes all the steps taken to compete among selling properties more important. Now that listings are scarce, buyers may be compelled to reduce expectations on location, property condition, etc. They also will have pressure in competitive situations to remove conditions on their offers.
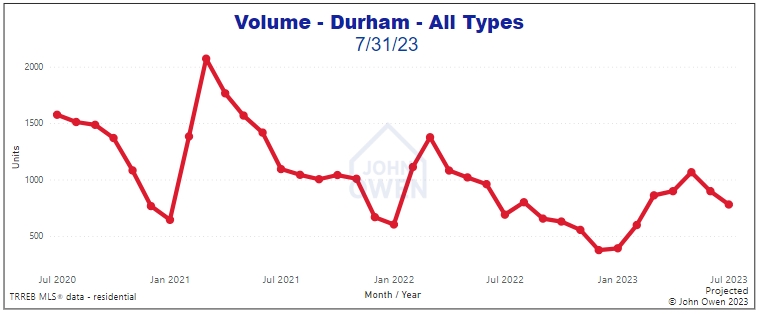
There were 770 units sold in July - down 14.3% from June and up 10.0% from the same period last year.
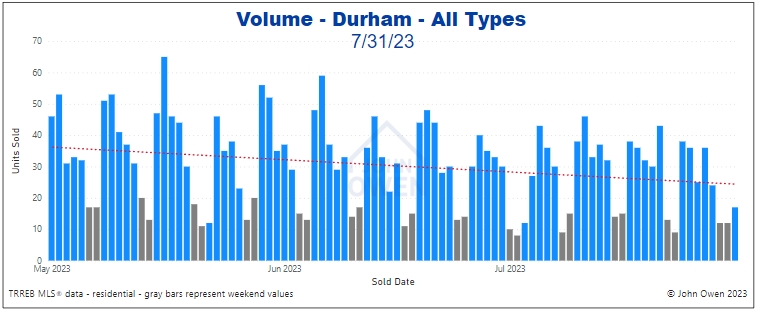
The following chart shows the daily sales volume for the past 3 months.
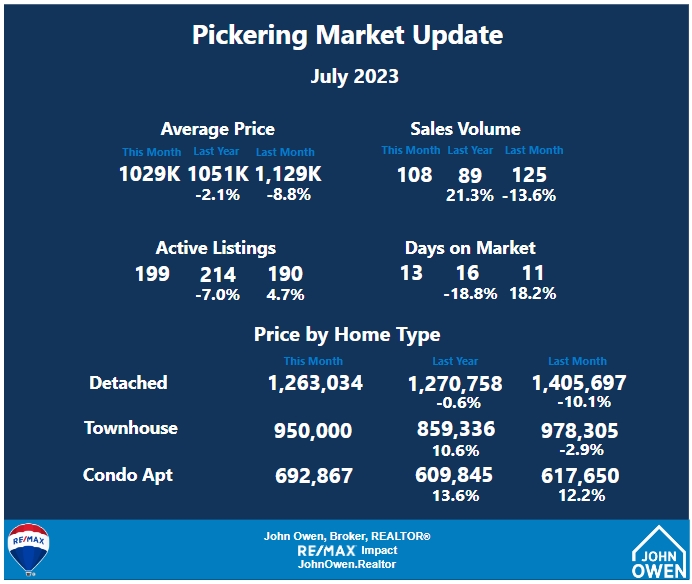
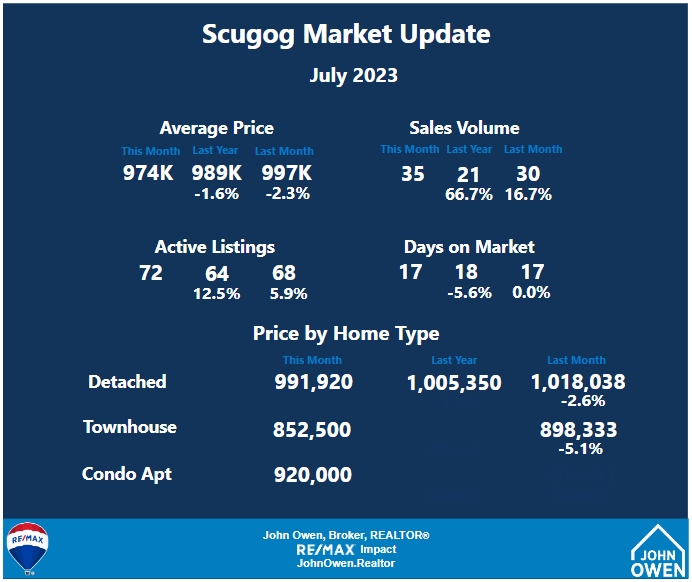
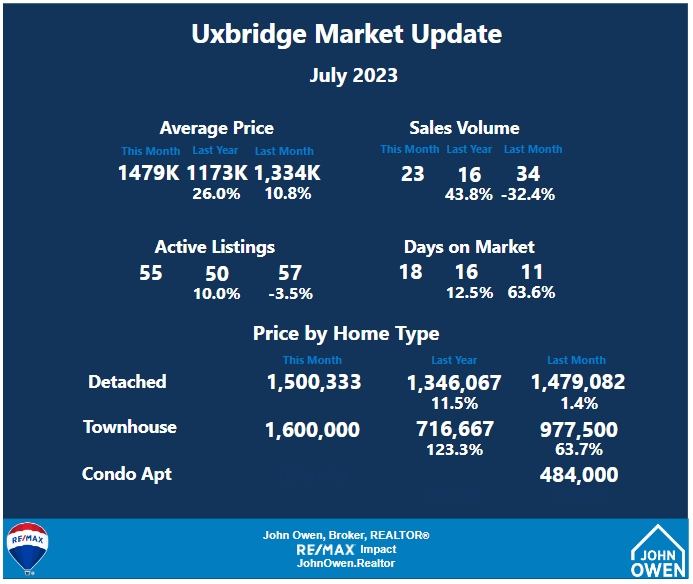
Here are the figures for each community in Durham Region:

Buyers will find multiple offers in many situations and price ranges, particularly at lower price points. They are highly advised to get prepared - have their mortgage preapproval ready before looking at homes, and be prepared to view homes via photos and virtual tours as soon as they reach the market. With interest rates being volatile, and mortgage qualification rules under review, locking in a rate is more important than ever. Speak with your agent to discuss the process to move forward.
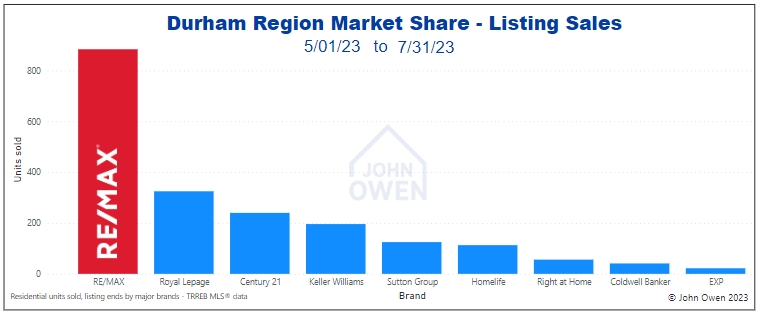
For those of you considering selling (or buying), the brand makes a big difference. When marketing a property, the size of the company and its network combined with the productivity of its agents can make a huge difference in the outcome. The following chart shows listing sales by major brands over the last 3 months:
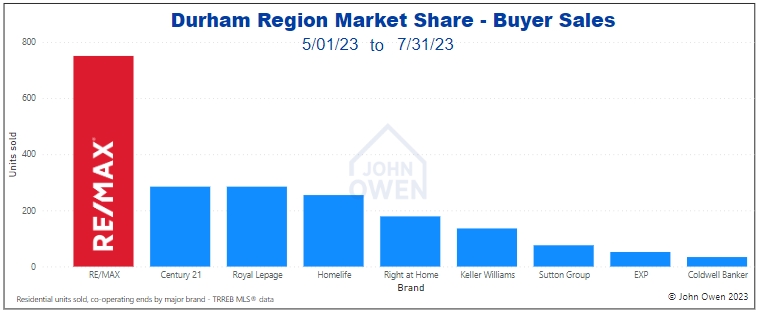
Here is a look at the market share for buyer agents, (also referred to as selling or cooperating).
Sellers should be considering getting on the market now or soon and working with their agent to set their home apart from competitive listings while reaching the widest possible audience.
If you are interested in seeing values for an area not shown or are interested in other figures, please comment below or contact me. As always, give me a call anytime if you would like to discuss this further without any obligation.
More Durham Region and Area Real Estate Articles
Peterborough Region Real Estate Market Report
Durham Region Property Tax Rates - GTA and Ontario
Durham Region Market Report - June 2023
About the Author

John Owen, Broker, RE/MAX Impact
John is an award-winning broker with RE/MAX Impact Realty in Courtice, ON, and is their number one agent for 2022.
Office - 905-240-6777
Email - johnowen@remax.net
Member, Canadian Real Estate Association (CREA), Ontario Real Estate Association (OREA), Toronto Regional Real Estate Board (TRREB).

Comments:
Post Your Comment: