

Compare Durham Region and GTA Property Tax Rates
Last updated December 10, 2025
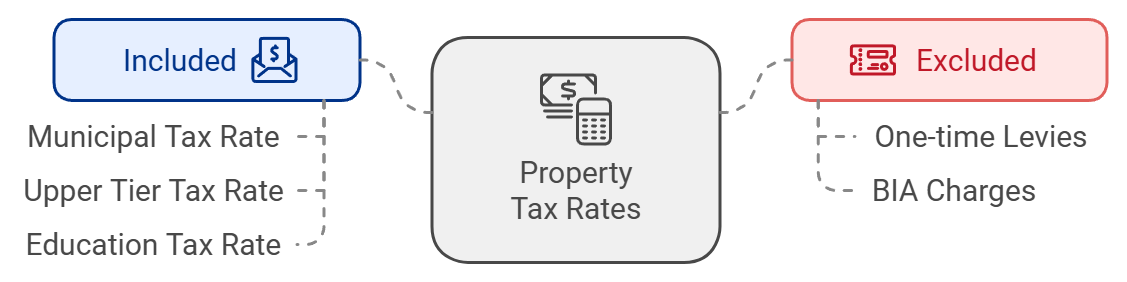
Property taxes vary significantly between municipalities in Durham Region and the GTA.
This article explores rates including the following:
Municipal tax rate
Upper tier municipality tax rate (county or region)
Education tax rate
It does not include other considerations, including these:
One-time levies
BIA charges
We include only the basics to provide a common baseline for comparison. There may also be minor differences between neighbourhoods in a given city. In those cases, we take the highest rate provided.
Durham Region Property Tax Rates 2025
GTA Property Tax Rates 2025
Q. Who has the highest property tax rates in the GTA?
A. Oshawa has the highest property tax rate in the Greater Toronto Area for 2025 at 1.524475%
Q. Who has the lowest property tax rates in the GTA?
A. Markham has the lowest property tax rate in the Greater Toronto Area for 2025 at 0.700278%
Durham Region Property Tax Increases for 2026
The Regional Municipality of Durham has proposed a huge 6.04% tax increase for 2026. It has since been amended to a 3.0% increase, and finally passed at 4.8%.
The City of Oshawa has proposed a 4.68% tax increase for 2026.
Whitby has proposed a 3.49% property tax increase for 2026.
Clarington has approved a 3.00% property tax hike for 2026.
Ajax has finalized it’s 2026 budget with a 1.28% increase for 2026.
Related articles:
Ontario Property Taxes by City 2025
Property Tax Calculator - Durham Region
Why are Property Tax Rates so High in Oshawa?
About the Author

John Owen, Broker, RE/MAX Impact
John is an award-winning RE/MAX broker based in Courtice, ON and serving a wide area from east GTA to Northumberland.
Direct - 905-434-0067
Email - johnowen.realtor@gmail.com
Member - RE/MAX Hall of Fame, Canadian Real Estate Association, Ontario Real Estate Association, Toronto Regional Real Estate Board.


Comments:
Post Your Comment: