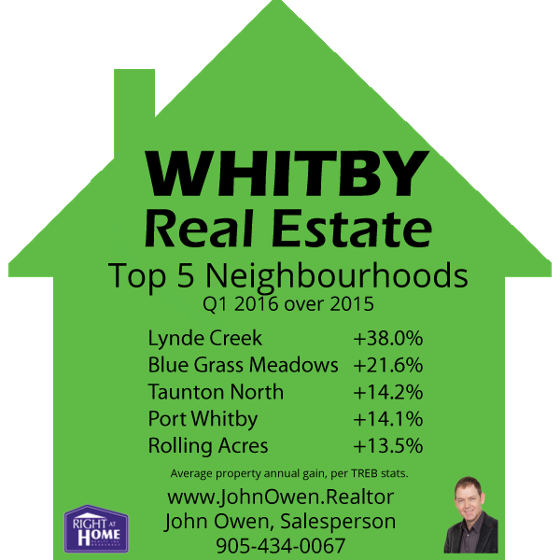
Whitby's real estate market has been very strong recently, but you may be surprised at how well some communities perform compared to others. The following results are from the first quarter of 2016 (January through March) as compared to the same period in 2015 for all residential home types.
Lynde Creek +38.0%
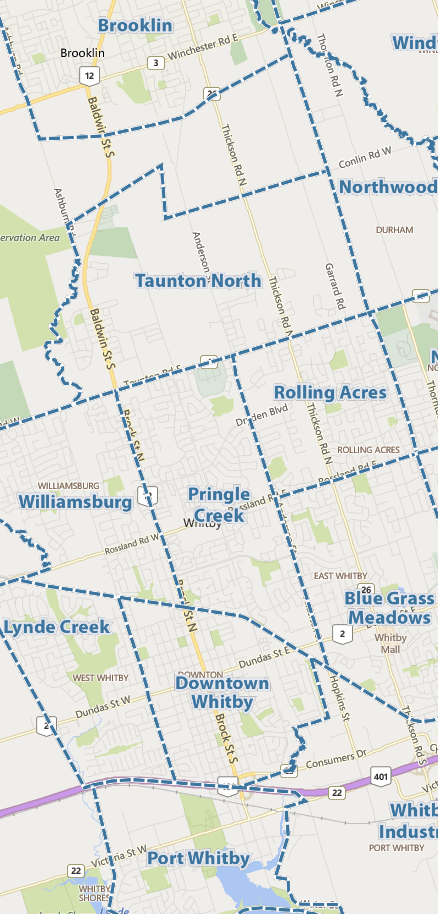
In first place by a huge margin is Lynde Creek. It is the area north of the 401, west of Cochrane Street/Annes Street, east of Halls Road N and south of the railway line near Rossland Road W. The average increase here was 38.0%, with an average price last quarter of $547,711. Last year, the average was $397,000.
Blue Grass Meadows +21.6%
In second spot was Blue Grass Meadows, which is north of Consumers Road, south of Rossland Road W, east of Anderson Street and west of the Oshawa border. The average increase here was 21.6%, with the average home selling for $511,141 in Q1 2016 versus $420,491 last year.
Taunton North +19.6%
Third place was Taunton North, which includes areas east of Heber Down Conservation Area, west of the midpoint between Garrard Road and Thornton Road, north of Taunton Road and south of Conlin Road W. The average gain was 19.6%, with a Q1 2016 price of $540,453 over Q1 2015 $473,193.
Port Whitby +14.1%
Fourth position went to Port Whitby. It is in the south-west corner of the city, below the 401 and west of Whitby Industrial. Average prices gained 14.1%, with a Q1 2016 price of $425,687 over last year's $373,056.
Rolling Acres +13.5%
Rolling Acres took fifth spot, with a 13.5% rise. It is west of the Oshawa border, east of Anderson, north of the Rossland Road W and south of Taunton Road W. The average price in Q1 2016 was $564,030. Last year it was $496,816.
The rest?
Some communities performed well under these ones, as shown below:
Pringle Creek +11.0%
Brooklin +10.9%
Downtown Whitby +10.8%
Williamsburg +7.7%
If you are interested in knowing how well your home has fared, please contact me for a complimentary market assessment.
Sales statistics are provided quarterly for neighbourhoods by the Toronto Real Estate Board, which hosts MLS sales data for Durham Region. The information provided here is for residential properties, in the first quarter (January through March) of 2016 as compared to the same period of 2015. Areas not reflected above did not have enough volume in one of the sales periods to provide a good comparison.


Comments:
Post Your Comment: