


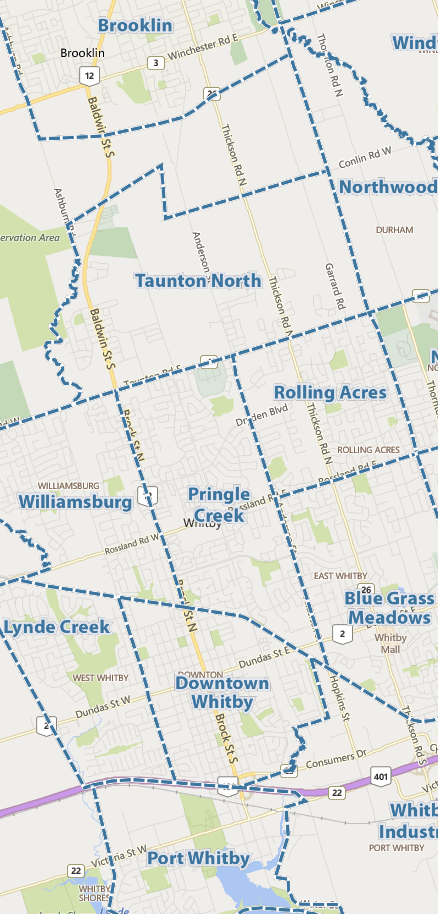
Everyone knows that Whitby's real estate market has been strong lately. Breaking down the statistics by community makes the numbers much more relative to specific neighbourhoods. The following results are from the fourth quarter of 2015 (October through December) as compared to the same period in 2014 for detached homes.
Port Whitby +20.1%
The number one community in Whitby was Port Whitby. It is the area south of the 401, west of Brock Street and east of Lynde Creek. The average increase here was an exceptional 20.1%, with the average price in Q4 of 2015 being $532,530. In Q4 of 2014 the average price was just $443,250.
Rolling Acres +16.9%
In second was Rolling Acres which is north of Rossland Road, south of Taunton Road, east of Anderson Street and west of the Oshawa border. The average gain here was 16.9%, with the average home selling for $542,031 in Q4 2015 versus $463,821 in Q4 2014.
Pringle Creek +14.8%
In third was Pringle Creek, located south of Taunton Road, east of Brock Street, west of Anderson Street and north of the rail line. With an average increase of 14.8%, the average price was $522,001 in Q4 2015 over an average of $454,721 in Q4 2014.
Taunton North +14.8%
Virtually tied for third was Taunton North, which is north of Taunton Road, south of Conlin Road, east of Heber Down Conservation Area and west of Thornton Road. Prices here jumped 14.8% with an average selling price of $549,972 in Q4 2015 and $479,263 in Q4 2014.
Brooklin +14%
Fifth place was Brooklin, which includes areas east of Ashburn Road, west of Garrard Road, north of highway 407 and south of Columbus Road West. The average increase was 14%, with a Q4 2015 price of $621,414 over Q4 2014 $545,187.
The rest?
Some communities performed well under these ones, as shown below:
Williamsburg +12.9%
Downtown Whitby +6%
Lynde Creek +4.2%
If you are interested in knowing how well your home has fared, please contact me for a complimentary market assessment.
Sales statistics are provided quarterly for neighbourhoods by the Toronto Real Estate Board, which hosts MLS sales data for Durham Region. The information provided here is for detached properties, in the fourth quarter (October through December) of 2015 as compared to the same period of 2014. Areas not reflected above did not have enough volume in one of the sales periods to provide a comparison.


Comments:
Post Your Comment: