

Oshawa Community Performance
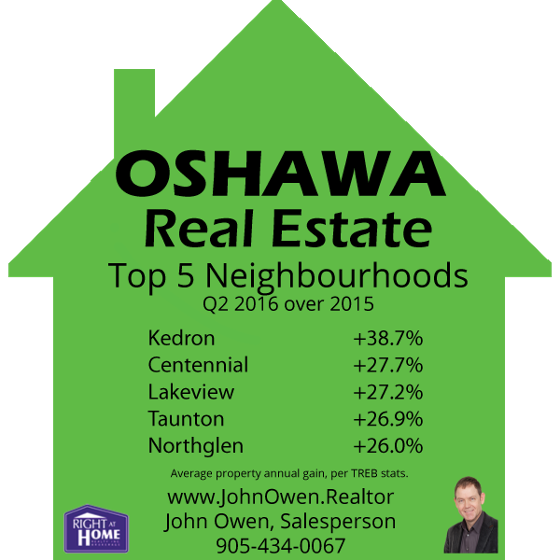
For the most recent quarter for which residential sales statistics are available, the following areas (or districts) showed the strongest year-over-year average price gain for the Oshawa area:
Kedron +38.7%
The number one area in Oshawa was Kedron, located west of Townline Road, east of Windfields, south of Winchester Road E, and north of Taunton Road E. The average increase here was an outstanding 38.7% with the average price in Q2 of 2016 being $661,500. In Q2 of 2015 the average price was $477,050.
Centennial +27.7%
In second spot was Centennial, located north of Rossland, south of Taunton, east of the airport and west of Wilson. With an average gain of 27.7%, the average price was $412,744 in Q2 2016 over an average of $323,153 last year.
Lakeview +27.2%
Third place was Lakeview. It is located roughly west of Simcoe, east of the GM plant and south of the 401. Prices rose an average of 27.2%, with a Q2 2016 value of $333,691 over last year's $262,301.
Taunton +26.9%
Fourth place went to Taunton, which is north of Taunton, south of Conlin Road E, east of Wilson and west of Townline. Prices here rose 26.9% with an average selling price of $628,918 in Q2 2016 versus $495,538 in Q2 2015.
Northglen +26.0%
In fifth place was Northglen. It is south of Taunton, north of Rossland, east of the Whitby border and west of Wilson Road S, and west of Oshawa creek. In Q2 2016 the average price was $559,423, compared to $444,113 in 2015.
The rest?
Some neighbourhoods performed well under these, as listed below:
Central +25.3%
Samac +24.9%
McLaughlin +24.6%
Windfields +23.2%
O'Neill +23.0%
Pinecrest +22.8%
Donevan +21.7%
Vanier +21.2%
Eastdale +12.2%
If you are interested in knowing how well your home has fared, please contact me for a complimentary market assessment.
Sales statistics are provided quarterly for neighbourhoods by the Toronto Real Estate Board, which hosts MLS sales data for Durham Region. The information provided here is for residential properties, in the second quarter (April through June) of 2016 as compared to the same period of 2015. Areas not reflected above did not have enough volume in one of the sales periods to provide a proper statistical comparison.

Additional reports:
Oshawa Top Areas


Comments:
Post Your Comment: