


Durham Region Monthly Market Report - March 2023
Last update April 5, 2023 at 11:30am
The real estate market in Durham Region has returned to a seller's market in March, with a strong surge in activity.
With low inventory and high demand, prices normally would be increasing rapidly, but the recent interest rate and inflation situation have clearly cut into buyer budgets, allowing prices to stay somewhat in check following a substantial drop in the spring months of last year.

There has been a recent jump in key metrics that measure the intensity of the market. Interest rates have stabilized or dropped, sales volume is rising, and multiple offer situations are rising along with average sale prices.
Supply is low to moderate, with 1.4 months of inventory (MOI) for the entire region (1.5 MOI per TRREB's trend figures), and much higher levels in northern Durham communities. (This means that at the current pace of sales, with no new listings, all inventory would be sold within this time frame).
Historically, we haven't seen a true buyer's market across Durham Region since 2008, as shown in the chart above. In December of that year, months of inventory spiked to 9.
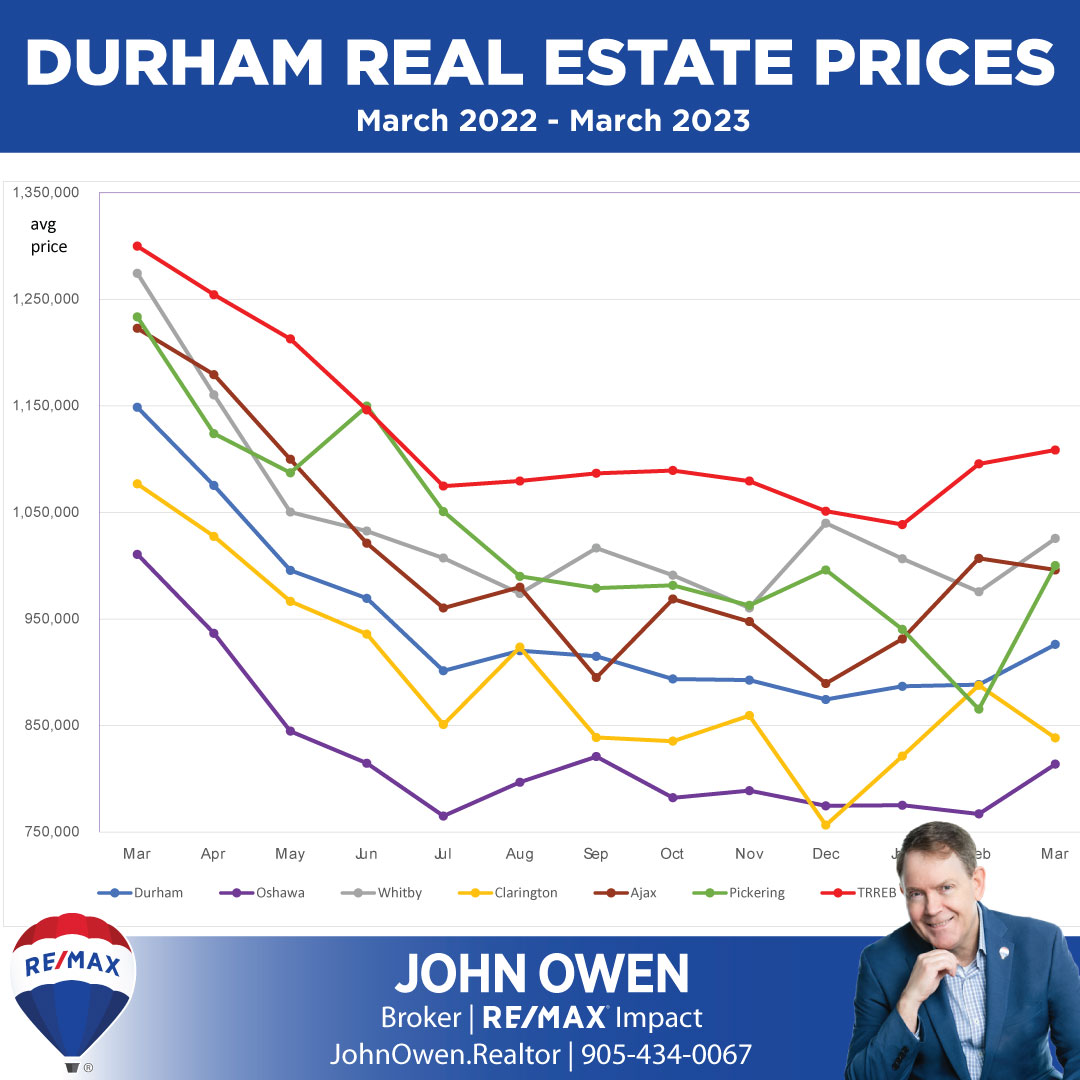
In March, transactions reported had selling prices averaging 926,142 in Durham Region. This is a 4.2% increase from last month and a 19.4% decrease from last year.
Here is a look at average detached home selling prices each day over the past 3 months:

The above chart shows average detached home prices by major region in the GTA in March.
The average selling price of detached homes is just under 1,040,000 overall, as summarized in the above map.
Townhouse sale prices are now averaging just under 860,000 across the region.
Durham Region Real Estate Market Reports by City
Of particular note is how the sale price to list price ratio has dropped at a much sharper rate than selling prices. This is due to two factors. First, more listings are being pulled off the market after not getting the results they wanted on the offer date published (with a lower than market list price), then re-listed at a (more realistic) higher price with no offer date. Second, more listings are being posted with no offer date at all, and a list price that is more in line with recent comparable sales.

More recently, SPLP has averaged near the 103% mark, indicating that the average property is selling for higher than its list price. This shows that a common scenario is for there to be more than one offer on properties, signalling that bidding situations are working back into the mix - just not with the same intensity as last year.
Days on market (DOM) averaged 14 days. DOM is the number of days it takes for a property to be sold firm, or without conditions.
Should new listings rise at a pace that is faster than current sales, then there would be more inventory for the pool of buyers to choose from, which will have the effect of reducing the sale price to list price ratio, then months of inventory stat, which leans the market closer to a balanced market.
Active listings had jumped sharply in the summer months, providing more options for buyers. They have since eased back from those levels.
It also makes all the steps taken to compete among selling properties more important. When listings were scarce, buyers were compelled to reduce expectations on location, property condition, etc. Those properties that have issues should now see challenges in attracting strong offers and competition.
Given that the average property sold at close to the list price, the slower pace of sales versus 2022 isn't solely due to decreased buyer demand. There is still a serious shortage of supply, although that factor has fluctuated as the past year progressed.
Buyers will continue to find multiple offers in some situations and price ranges, particularly at lower price points. They are highly advised to get prepared - have their mortgage preapproval ready before looking at homes, and be prepared to view homes via photos and virtual tours as soon as they reach the market. With interest rates rising, locking in a rate is more important than ever. Speak with your agent to discuss the process to move forward.
For those of you considering selling (or buying), brand makes a big difference. When marketing a property, the size of the company and its network combined with the productivity of its agents can make a huge difference in the outcome. The following chart shows listing sales by major brands over the last 3 months:

Here is a look at the market share for buyer agents, (also referred to as selling or co-operating).

Sellers should be considering getting on the market now or soon, and working with their agent to set their home apart from competitive listings while reaching the widest possible audience.
If you are interested in seeing values for an area not shown or are interested in other figures, please comment below or contact me. As always, give me a call anytime if you would like to discuss this further without any obligation.
Other Regions
Peterborough Region Real Estate Market Report
Durham Region Property Tax Rates - GTA and Ontario
About the Author

John Owen is an award-winning broker with RE/MAX Impact Realty in Courtice, ON.
Office - 905-240-6777
Member, Canadian Real Estate Association (CREA), Ontario Real Estate Association (OREA), Toronto Regional Real Estate Board (TRREB).


Comments:
Post Your Comment: