
Oshawa Community Performance
For the most recent quarter for which residential sales statistics are available, the following areas (or districts) showed the strongest year-over-year average price gain for the Oshawa area:

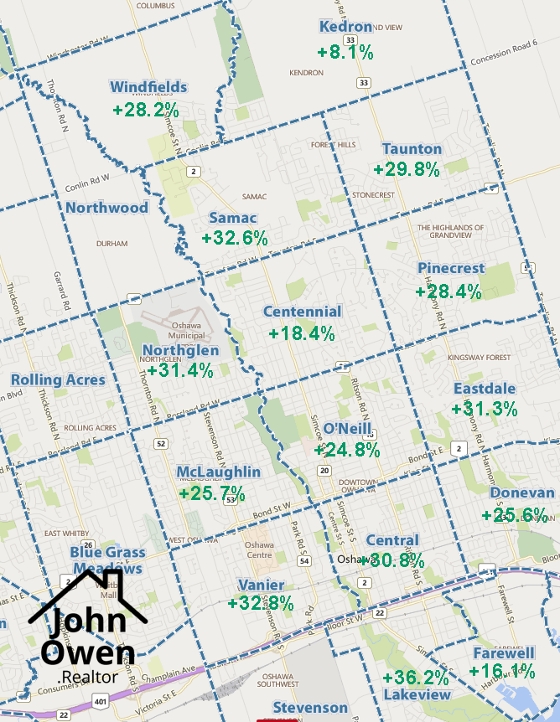
Lakeview +36.2%
The number one area in Oshawa was Lakeview. It is located roughly west of Simcoe, east of the GM plant and south of the 401. The average increase here was an outstanding 36.2% with the average price in Q3 of 2016 being $334,714. In Q3 of 2015 the average price was $245,663.
Vanier +32.8%
In second spot was Vanier, located between King Street and the 401 and west of , east of the airport and west of Oshawa Creek (just west of Centre Street). With an average gain of 32.8%, the average price was $336,202 in Q3 2016 over an average of $253,129 last year.
Samac +32.6%
Third place was Samac. It is located between Conlin Road and Taunton Road, west of Wilson Road over to Oshawa Creek (just west of the UOIT campus). Prices rose an average of 32.6%, with a Q3 2016 value of $495,059 over last year's $373,461.
Northglen +31.4%
Fourth place went to Northglen. It is south of Taunton, north of Rossland, east of the Whitby border and west of Wilson Road S, and west of Oshawa Creek. Prices here rose 31.4% with an average selling price of $603,330 in Q3 2016 versus $459,167 in Q3 2015.
Eastdale +31.3%
In fifth place was Eastdale at 31.3%. It is between King Street and Rossland Road. In Q3 2016 the average price was $450,986, compared to $343,402 in 2015.
The rest?
Some neighbourhoods performed well under these, as listed below:
Central +30.8%
Taunton +29.8%
Pinecrest +28.4%
Windfields +28.2%
McLaughlin +25.7%
Donevan +25.6%
O'Neill +24.8%
Centennial +18.4%
Farewell +16.1%
Kedron +8.1%
If you are interested in knowing how well your home has fared, please contact me for a complimentary market assessment.
Sales statistics are provided quarterly for neighbourhoods by the Toronto Real Estate Board, which hosts MLS sales data for Durham Region. The information provided here is for residential properties, in the third quarter (July through September) of 2016 as compared to the same period of 2015. Areas not reflected above did not have enough volume in one of the sales periods to provide a proper statistical comparison.


Comments:
Post Your Comment: