
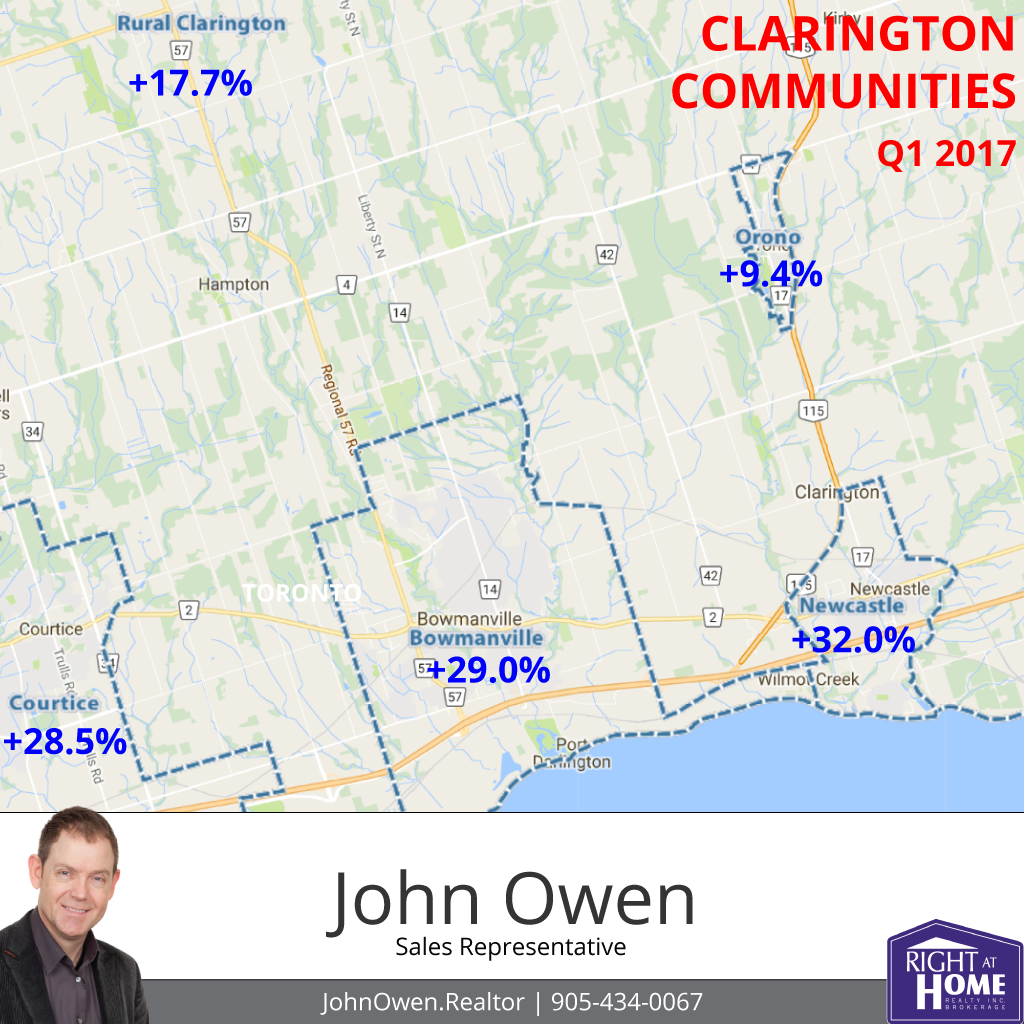
Clarington's Top Real Estate Areas
Considering buying or selling a home in Clarington? It would help to understand which MLS districts are performing best in the area.
This article shows which ones are doing best in the most recent quarter for which residential sales figures are available.
Newcastle +32.0%

The number one area in Clarington was Newcastle. The average one year increase here was exceptional at 32% with the average price in Q1 of 2017 being $573,983. In Q1 of 2016 the average price was $390,222.
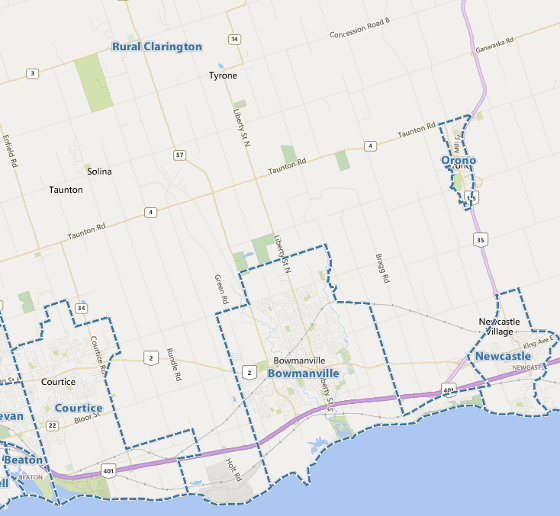
It's only a few minutes east of Bowmanville on the 401, with a small town feel.
Bowmanville +29.0%
In second spot was Bowmanville. With an average gain of 29.0%, the average price was $563,588 in Q1 2017 over an average of $400,053 last year.
Contributing to Bowmanville demand is a planned GO train extension and refurbishment project at Darlington.
Courtice +28.5%

Third place was Courtice. Prices gained an average of 28.5%, with a Q1 2017 value of $597,492 over last year's $427,271.
Rural Clarington +17.7%
Fourth place went to Rural Clarington. Prices here rose 17.7% with an average selling price of $789,680 in Q1 2017 versus $650,128 in 2016.
Providing substantially to the rise here is the 407 extension that is rapidly working its way through the area. It is expected to be open to east of Courtice, as well as the 418 link to the 401 by the end of 2017.
These two arterial links will provide timely access for Rural Clarington residents to the southern Durham areas, as well as to the Toronto area.
Orono +9.4%
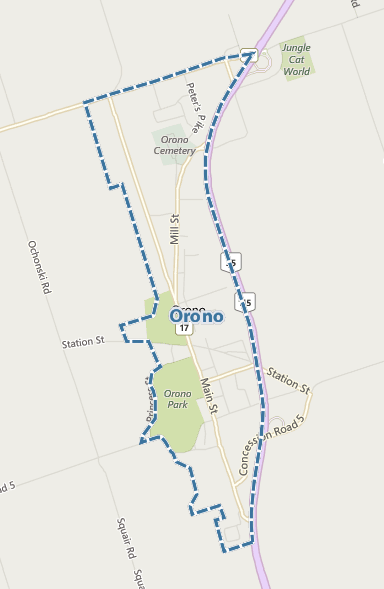
In fifth place was Orono. In Q1 2017 the average price was $493,950 compared to $447,386 in 2016, for a gain of 9.4%.
Orono is the smallest of the areas in Clarington. It has a small town vibe but has enough amenities to make frequent trips elsewhere unnecessary.
The location along highway 115, and also just south of the new highway 407 terminus makes it highly accessible to the rest of the GTA and cottage country.
If you are interested in knowing how well your home has fared, please contact me for a complimentary market assessment.
Sales statistics are provided quarterly for neighbourhoods by the Toronto Real Estate Board, which hosts MLS sales data for Durham Region. The information provided here is for residential properties, in the first quarter (January to March) of 2017 as compared to the same period of 2016. Areas not reflected above did not have enough volume in one of the sales periods to provide a proper statistical comparison.

Comments:
Post Your Comment: